29
/es/
es
AIzaSyAYiBZKx7MnpbEhh9jyipgxe19OcubqV5w
April 1, 2024
254373
Suriname
SUR
true
2
1
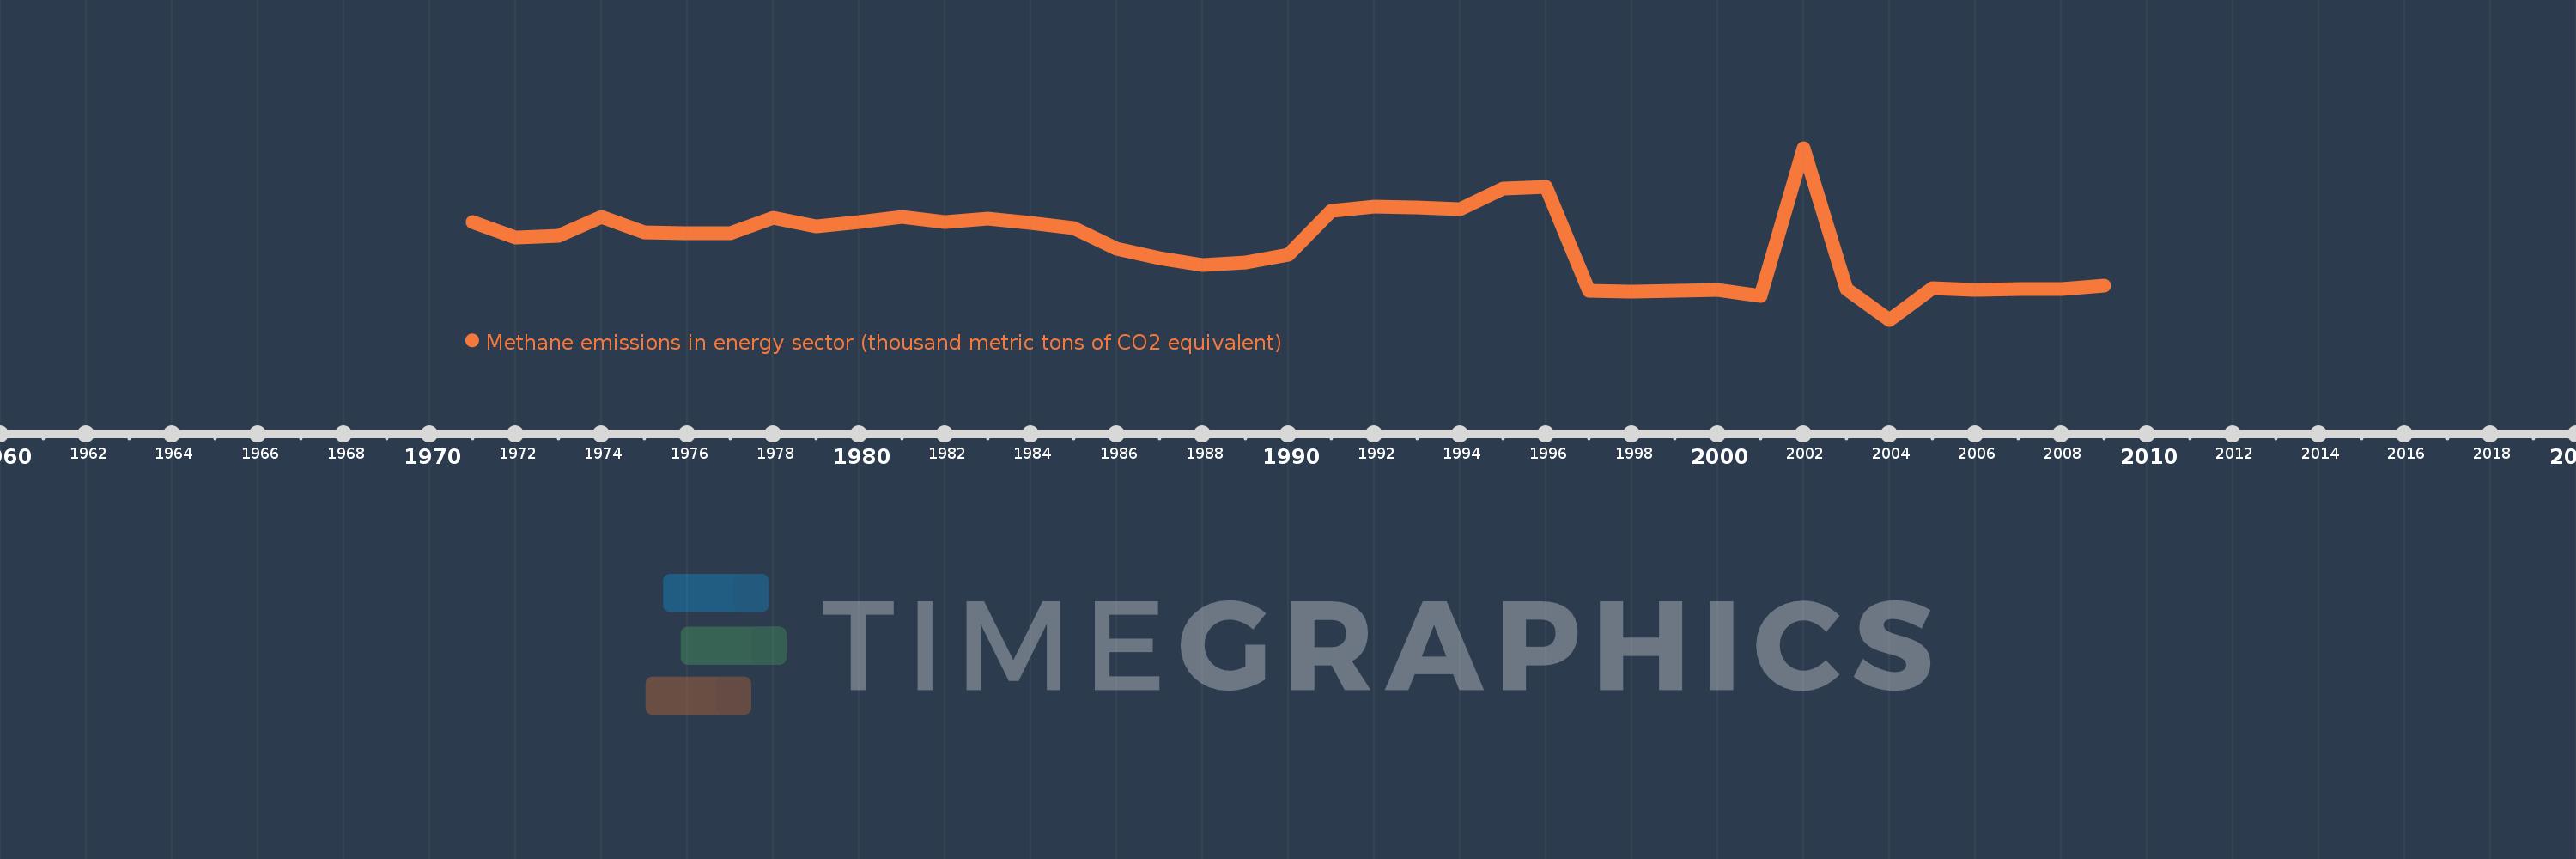
Methane emissions in energy sector (thousand metric tons of CO2 equivalent)
2009,2008,2007,2006,2005,2004,2003,2002,2001,2000,1999,1998,1997,1996,1995,1994,1993,1992,1991,1990,1989,1988,1987,1986,1985,1984,1983,1982,1981,1980,1979,1978,1977,1976,1975,1974,1973,1972,1971
Estas estadísticas en otros países:
AfghanistanAlbaniaAlgeriaAmerican SamoaAndorraAngolaAntigua and BarbudaArab WorldArgentinaArmeniaArubaAustraliaAustriaAzerbaijanBahamas, TheBahrainBangladeshBarbadosBelarusBelgiumBelizeBeninBermudaBhutanBoliviaBosnia and HerzegovinaBotswanaBrazilBritish Virgin IslandsBrunei DarussalamBulgariaBurkina FasoBurundiCabo VerdeCambodiaCameroonCanadaCaribbean small statesCayman IslandsCentral African RepublicCentral Europe and the BalticsChadChannel IslandsChileChinaColombiaComorosCongo, Dem. Rep.Congo, Rep.Costa RicaCote d'IvoireCroatiaCubaCuracaoCyprusCzech RepublicDenmarkDjiboutiDominicaDominican RepublicEarly-demographic dividendEast Asia & PacificEast Asia & Pacific (excluding high income)East Asia & Pacific (IDA & IBRD countries)EcuadorEgypt, Arab Rep.El SalvadorEquatorial GuineaEritreaEstoniaEthiopiaEuro areaEurope & Central AsiaEurope & Central Asia (excluding high income)Europe & Central Asia (IDA & IBRD countries)European UnionFaroe IslandsFijiFinlandFragile and conflict affected situationsFranceFrench PolynesiaGabonGambia, TheGeorgiaGermanyGhanaGibraltarGreeceGreenlandGrenadaGuamGuatemalaGuineaGuinea-BissauGuyanaHaitiHeavily indebted poor countries (HIPC)High incomeHondurasHong Kong SAR, ChinaHungaryIBRD onlyIcelandIDA & IBRD totalIDA blendIDA onlyIDA totalIndiaIndonesiaIran, Islamic Rep.IraqIrelandIsle of ManIsraelItalyJamaicaJapanJordanKazakhstanKenyaKiribatiKorea, Dem. People’s Rep.Korea, Rep.KosovoKuwaitKyrgyz RepublicLao PDRLate-demographic dividendLatin America & Caribbean Latin America & Caribbean (excluding high income)Latin America & the Caribbean (IDA & IBRD countries)LatviaLeast developed countries: UN classificationLebanonLesothoLiberiaLibyaLiechtensteinLithuaniaLow & middle incomeLow incomeLower middle incomeLuxembourgMacao SAR, ChinaMacedonia, FYRMadagascarMalawiMalaysiaMaldivesMaliMaltaMarshall IslandsMauritaniaMauritiusMexicoMicronesia, Fed. Sts.Middle East & North AfricaMiddle East & North Africa (excluding high income)Middle East & North Africa (IDA & IBRD countries)Middle incomeMoldovaMonacoMongoliaMontenegroMoroccoMozambiqueMyanmarNamibiaNauruNepalNetherlandsNew CaledoniaNew ZealandNicaraguaNigerNigeriaNorth AmericaNorthern Mariana IslandsNorwayOECD membersOmanOther small statesPacific island small statesPakistanPalauPanamaPapua New GuineaParaguayPeruPhilippinesPolandPortugalPost-demographic dividendPre-demographic dividendPuerto RicoQatarRomaniaRussian FederationRwandaSamoaSan MarinoSao Tome and PrincipeSaudi ArabiaSenegalSerbiaSeychellesSierra LeoneSingaporeSint Maarten (Dutch part)Slovak RepublicSloveniaSmall statesSolomon IslandsSomaliaSouth AfricaSouth AsiaSouth Asia (IDA & IBRD)South SudanSpainSri LankaSt. Kitts and NevisSt. LuciaSt. Martin (French part)St. Vincent and the GrenadinesSub-Saharan Africa Sub-Saharan Africa (excluding high income)Sub-Saharan Africa (IDA & IBRD countries)SudanSurinameSwazilandSwedenSwitzerlandSyrian Arab RepublicTajikistanTanzaniaThailandTimor-LesteTogoTongaTrinidad and TobagoTunisiaTurkeyTurkmenistanTurks and Caicos IslandsTuvaluUgandaUkraineUnited Arab EmiratesUnited KingdomUnited StatesUpper middle incomeUruguayUzbekistanVanuatuVenezuela, RBVietnamVirgin Islands (U.S.)West Bank and GazaWorldYemen, Rep.ZambiaZimbabwe línea de tiempo (timeline):
En esta escala de tiempo se presenta un gráfico de 1971 y 2009 de Suriname. Los datos de 1970 están ausentes. El número de observaciones reales por fecha: 39.
Fuente (nombre):
Indicadores del desarrollo mundial
Fuente (organización):
European Commission, Joint Research Centre (JRC)/Netherlands Environmental Assessment Agency (PBL). Emission Database for Global Atmospheric Research (EDGAR): http://edgar.jrc.ec.europa.eu/
Categorías:
Energy & Mining, Environment
Se ha actualizado:
23 abr 2017 año
Los indicadores de los cambios de valor en los últimos años
Mínimo:
10.471
1 ene 2004 año
Máximo:
66.075
1 ene 2002 año
A la fecha de observación
Valor
Cambio absoluto
El cambio con respecto al valor anterior
1 ene 1971 año
41.996
+41.996
0.0%
1 ene 1972 año
37.022
-4.975
-11.85%
1 ene 1973 año
37.639
+0.618
1.67%
1 ene 1974 año
43.807
+6.168
16.39%
1 ene 1975 año
38.849
-4.958
-11.32%
1 ene 1976 año
38.516
-0.333
-0.86%
1 ene 1977 año
38.487
-0.029
-0.08%
1 ene 1978 año
43.596
+5.109
13.28%
1 ene 1979 año
40.704
-2.892
-6.63%
1 ene 1980 año
42.113
+1.409
3.46%
1 ene 1981 año
43.677
+1.565
3.72%
1 ene 1982 año
41.95
-1.727
-3.95%
1 ene 1983 año
43.097
+1.147
2.73%
1 ene 1984 año
41.676
-1.421
-3.3%
1 ene 1985 año
40.031
-1.645
-3.95%
1 ene 1986 año
33.329
-6.702
-16.74%
1 ene 1987 año
30.467
-2.862
-8.59%
1 ene 1988 año
28.15
-2.317
-7.6%
1 ene 1989 año
28.967
+0.817
2.9%
1 ene 1990 año
31.501
+2.534
8.75%
1 ene 1991 año
45.664
+14.163
44.96%
1 ene 1992 año
47.035
+1.371
3.0%
1 ene 1993 año
46.742
-0.293
-0.62%
1 ene 1994 año
46.369
-0.373
-0.8%
1 ene 1995 año
52.953
+6.584
14.2%
1 ene 1996 año
53.444
+0.491
0.93%
1 ene 1997 año
19.958
-33.487
-62.66%
1 ene 1998 año
19.674
-0.283
-1.42%
1 ene 1999 año
19.973
+0.299
1.52%
1 ene 2000 año
20.175
+0.202
1.01%
1 ene 2001 año
18.07
-2.106
-10.44%
1 ene 2002 año
66.075
+48.005
265.67%
1 ene 2003 año
20.294
-45.781
-69.29%
1 ene 2004 año
10.471
-9.824
-48.41%
1 ene 2005 año
20.62
+10.15
96.93%
1 ene 2006 año
20.196
-0.424
-2.06%
1 ene 2007 año
20.307
+0.111
0.55%
1 ene 2008 año
20.365
+0.058
0.29%
1 ene 2009 año
21.604
+1.238
6.08%
Ranking de los países por los datos estadísticos actuales


Comentarios: