29
/es/
es
AIzaSyAYiBZKx7MnpbEhh9jyipgxe19OcubqV5w
April 1, 2024
116031
Cuba
CUB
true
2
1
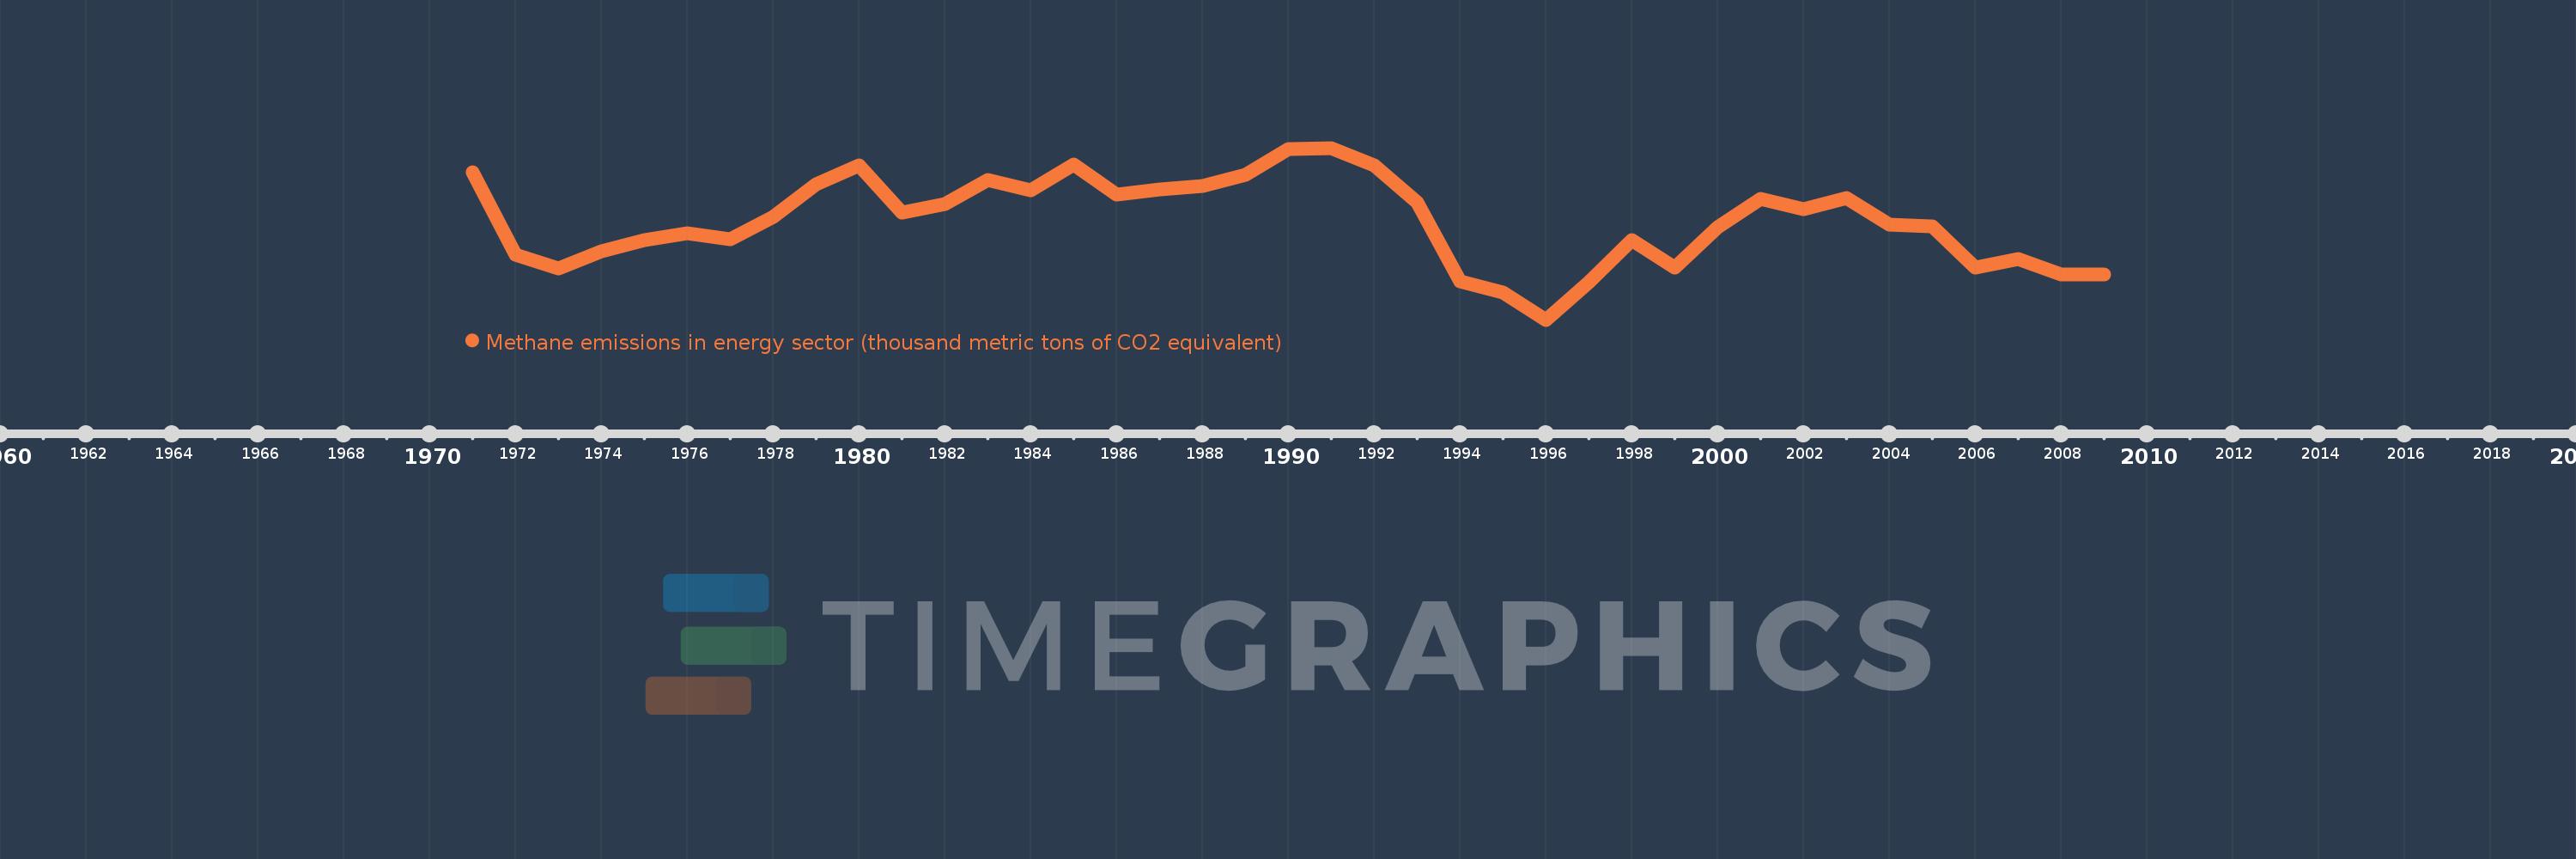
Methane emissions in energy sector (thousand metric tons of CO2 equivalent)
2009,2008,2007,2006,2005,2004,2003,2002,2001,2000,1999,1998,1997,1996,1995,1994,1993,1992,1991,1990,1989,1988,1987,1986,1985,1984,1983,1982,1981,1980,1979,1978,1977,1976,1975,1974,1973,1972,1971
Estas estadísticas en otros países:
AfghanistanAlbaniaAlgeriaAmerican SamoaAndorraAngolaAntigua and BarbudaArab WorldArgentinaArmeniaArubaAustraliaAustriaAzerbaijanBahamas, TheBahrainBangladeshBarbadosBelarusBelgiumBelizeBeninBermudaBhutanBoliviaBosnia and HerzegovinaBotswanaBrazilBritish Virgin IslandsBrunei DarussalamBulgariaBurkina FasoBurundiCabo VerdeCambodiaCameroonCanadaCaribbean small statesCayman IslandsCentral African RepublicCentral Europe and the BalticsChadChannel IslandsChileChinaColombiaComorosCongo, Dem. Rep.Congo, Rep.Costa RicaCote d'IvoireCroatiaCubaCuracaoCyprusCzech RepublicDenmarkDjiboutiDominicaDominican RepublicEarly-demographic dividendEast Asia & PacificEast Asia & Pacific (excluding high income)East Asia & Pacific (IDA & IBRD countries)EcuadorEgypt, Arab Rep.El SalvadorEquatorial GuineaEritreaEstoniaEthiopiaEuro areaEurope & Central AsiaEurope & Central Asia (excluding high income)Europe & Central Asia (IDA & IBRD countries)European UnionFaroe IslandsFijiFinlandFragile and conflict affected situationsFranceFrench PolynesiaGabonGambia, TheGeorgiaGermanyGhanaGibraltarGreeceGreenlandGrenadaGuamGuatemalaGuineaGuinea-BissauGuyanaHaitiHeavily indebted poor countries (HIPC)High incomeHondurasHong Kong SAR, ChinaHungaryIBRD onlyIcelandIDA & IBRD totalIDA blendIDA onlyIDA totalIndiaIndonesiaIran, Islamic Rep.IraqIrelandIsle of ManIsraelItalyJamaicaJapanJordanKazakhstanKenyaKiribatiKorea, Dem. People’s Rep.Korea, Rep.KosovoKuwaitKyrgyz RepublicLao PDRLate-demographic dividendLatin America & Caribbean Latin America & Caribbean (excluding high income)Latin America & the Caribbean (IDA & IBRD countries)LatviaLeast developed countries: UN classificationLebanonLesothoLiberiaLibyaLiechtensteinLithuaniaLow & middle incomeLow incomeLower middle incomeLuxembourgMacao SAR, ChinaMacedonia, FYRMadagascarMalawiMalaysiaMaldivesMaliMaltaMarshall IslandsMauritaniaMauritiusMexicoMicronesia, Fed. Sts.Middle East & North AfricaMiddle East & North Africa (excluding high income)Middle East & North Africa (IDA & IBRD countries)Middle incomeMoldovaMonacoMongoliaMontenegroMoroccoMozambiqueMyanmarNamibiaNauruNepalNetherlandsNew CaledoniaNew ZealandNicaraguaNigerNigeriaNorth AmericaNorthern Mariana IslandsNorwayOECD membersOmanOther small statesPacific island small statesPakistanPalauPanamaPapua New GuineaParaguayPeruPhilippinesPolandPortugalPost-demographic dividendPre-demographic dividendPuerto RicoQatarRomaniaRussian FederationRwandaSamoaSan MarinoSao Tome and PrincipeSaudi ArabiaSenegalSerbiaSeychellesSierra LeoneSingaporeSint Maarten (Dutch part)Slovak RepublicSloveniaSmall statesSolomon IslandsSomaliaSouth AfricaSouth AsiaSouth Asia (IDA & IBRD)South SudanSpainSri LankaSt. Kitts and NevisSt. LuciaSt. Martin (French part)St. Vincent and the GrenadinesSub-Saharan Africa Sub-Saharan Africa (excluding high income)Sub-Saharan Africa (IDA & IBRD countries)SudanSurinameSwazilandSwedenSwitzerlandSyrian Arab RepublicTajikistanTanzaniaThailandTimor-LesteTogoTongaTrinidad and TobagoTunisiaTurkeyTurkmenistanTurks and Caicos IslandsTuvaluUgandaUkraineUnited Arab EmiratesUnited KingdomUnited StatesUpper middle incomeUruguayUzbekistanVanuatuVenezuela, RBVietnamVirgin Islands (U.S.)West Bank and GazaWorldYemen, Rep.ZambiaZimbabwe línea de tiempo (timeline):
En esta escala de tiempo se presenta un gráfico de 1971 y 2009 de Cuba. Los datos de 1970 están ausentes. El número de observaciones reales por fecha: 39.
Fuente (nombre):
Indicadores del desarrollo mundial
Fuente (organización):
European Commission, Joint Research Centre (JRC)/Netherlands Environmental Assessment Agency (PBL). Emission Database for Global Atmospheric Research (EDGAR): http://edgar.jrc.ec.europa.eu/
Categorías:
Energy & Mining, Environment
Se ha actualizado:
23 abr 2017 año
Los indicadores de los cambios de valor en los últimos años
Mínimo:
702.673
1 ene 1996 año
Máximo:
1.253 mil
1 ene 1991 año
A la fecha de observación
Valor
Cambio absoluto
El cambio con respecto al valor anterior
1 ene 1971 año
1.175 mil
+1.175 mil
0.0%
1 ene 1972 año
912.305
-262.99
-22.38%
1 ene 1973 año
866.74
-45.565
-4.99%
1 ene 1974 año
923.184
+56.444
6.51%
1 ene 1975 año
958.872
+35.688
3.87%
1 ene 1976 año
980.492
+21.62
2.25%
1 ene 1977 año
961.519
-18.973
-1.94%
1 ene 1978 año
1.033 mil
+71.685
7.46%
1 ene 1979 año
1.138 mil
+104.62
10.13%
1 ene 1980 año
1.197 mil
+58.94
5.18%
1 ene 1981 año
1.047 mil
-149.596
-12.5%
1 ene 1982 año
1.075 mil
+27.646
2.64%
1 ene 1983 año
1.15 mil
+75.232
7.0%
1 ene 1984 año
1.118 mil
-32.207
-2.8%
1 ene 1985 año
1.199 mil
+81.562
7.3%
1 ene 1986 año
1.103 mil
-96.751
-8.07%
1 ene 1987 año
1.121 mil
+18.543
1.68%
1 ene 1988 año
1.132 mil
+11.055
0.99%
1 ene 1989 año
1.168 mil
+35.995
3.18%
1 ene 1990 año
1.249 mil
+81.149
6.95%
1 ene 1991 año
1.253 mil
+4.06
0.32%
1 ene 1992 año
1.197 mil
-56.268
-4.49%
1 ene 1993 año
1.079 mil
-118.618
-9.91%
1 ene 1994 año
824.948
-253.616
-23.51%
1 ene 1995 año
789.574
-35.374
-4.29%
1 ene 1996 año
702.673
-86.901
-11.01%
1 ene 1997 año
821.839
+119.165
16.96%
1 ene 1998 año
957.091
+135.252
16.46%
1 ene 1999 año
870.185
-86.906
-9.08%
1 ene 2000 año
998.054
+127.87
14.69%
1 ene 2001 año
1.089 mil
+91.386
9.16%
1 ene 2002 año
1.057 mil
-32.778
-3.01%
1 ene 2003 año
1.093 mil
+36.471
3.45%
1 ene 2004 año
1.007 mil
-86.511
-7.91%
1 ene 2005 año
1.001 mil
-5.566
-0.55%
1 ene 2006 año
869.689
-131.367
-13.12%
1 ene 2007 año
896.57
+26.881
3.09%
1 ene 2008 año
847.708
-48.862
-5.45%
1 ene 2009 año
848.365
+0.657
0.08%
Ranking de los países por los datos estadísticos actuales


Comentarios: