29
/es/
es
AIzaSyAYiBZKx7MnpbEhh9jyipgxe19OcubqV5w
April 1, 2024
253764
Sudan
SDN
true
2
1
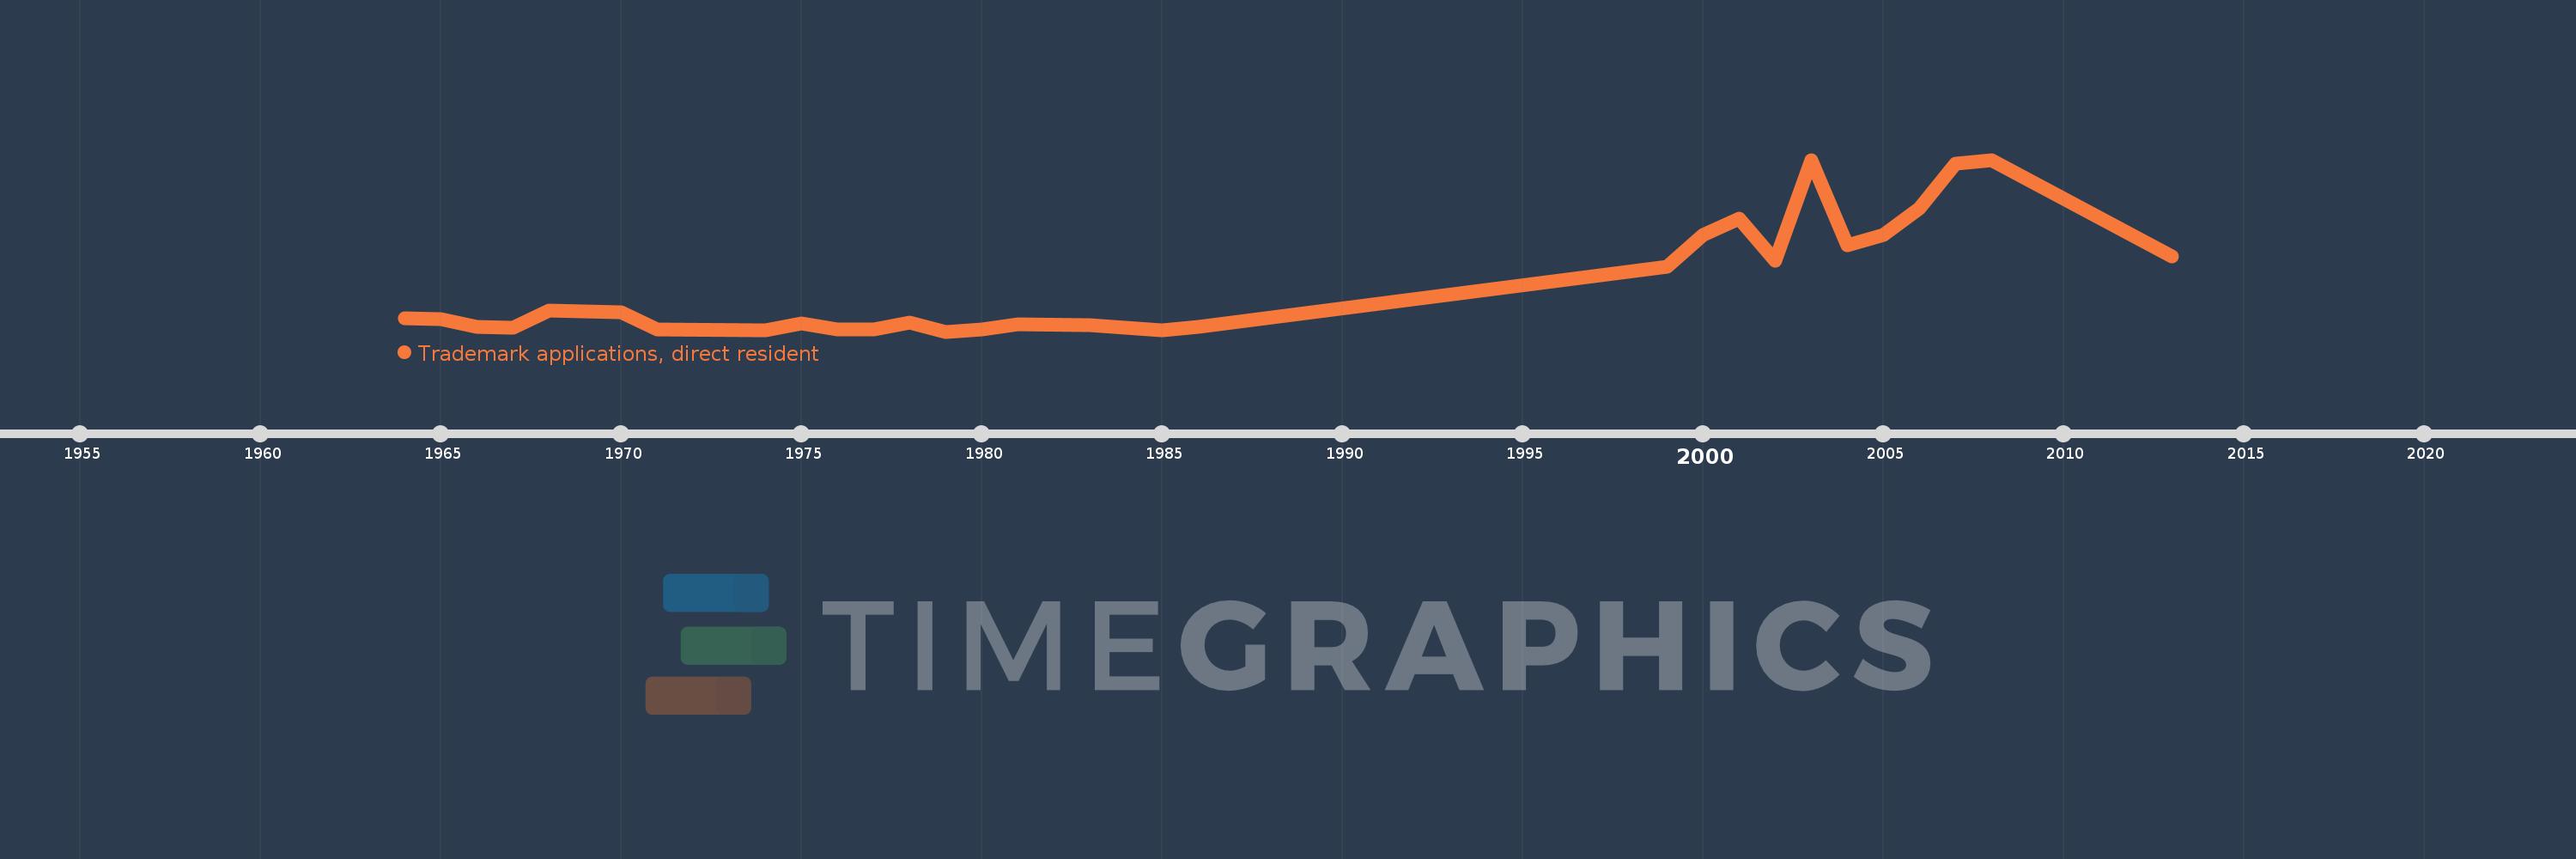
Trademark applications, direct resident
2013,2008,2007,2006,2005,2004,2003,2002,2001,2000,1999,1986,1985,1983,1981,1980,1979,1978,1977,1976,1975,1974,1971,1970,1968,1967,1966,1965,1964
Estas estadísticas en otros países:
AlbaniaAlgeriaAndorraAngolaArab WorldArgentinaArmeniaArubaAustraliaAustriaAzerbaijanBahamas, TheBahrainBangladeshBarbadosBelarusBelgiumBelizeBhutanBoliviaBosnia and HerzegovinaBotswanaBrazilBrunei DarussalamBulgariaBurkina FasoBurundiCabo VerdeCambodiaCanadaCaribbean small statesCentral Europe and the BalticsChileChinaColombiaCongo, Dem. Rep.Costa RicaCroatiaCubaCuracaoCyprusCzech RepublicDenmarkDjiboutiDominicaDominican RepublicEarly-demographic dividendEast Asia & PacificEast Asia & Pacific (excluding high income)East Asia & Pacific (IDA & IBRD countries)EcuadorEgypt, Arab Rep.El SalvadorEstoniaEthiopiaEuro areaEurope & Central AsiaEurope & Central Asia (excluding high income)Europe & Central Asia (IDA & IBRD countries)European UnionFijiFinlandFranceGambia, TheGeorgiaGermanyGhanaGreeceGrenadaGuatemalaGuineaGuinea-BissauGuyanaHaitiHigh incomeHondurasHong Kong SAR, ChinaHungaryIBRD onlyIcelandIDA & IBRD totalIDA blendIndiaIndonesiaIran, Islamic Rep.IraqIrelandIsraelItalyJamaicaJapanJordanKazakhstanKenyaKorea, Dem. People’s Rep.Korea, Rep.KuwaitKyrgyz RepublicLao PDRLate-demographic dividendLatin America & Caribbean Latin America & Caribbean (excluding high income)Latin America & the Caribbean (IDA & IBRD countries)LatviaLebanonLesothoLiberiaLibyaLiechtensteinLithuaniaLow & middle incomeLower middle incomeLuxembourgMacao SAR, ChinaMacedonia, FYRMadagascarMalawiMalaysiaMaldivesMaliMaltaMauritiusMexicoMiddle East & North AfricaMiddle East & North Africa (excluding high income)Middle East & North Africa (IDA & IBRD countries)Middle incomeMoldovaMonacoMongoliaMontenegroMoroccoMozambiqueMyanmarNamibiaNepalNetherlandsNew ZealandNicaraguaNigeriaNorth AmericaNorwayOECD membersOmanPakistanPanamaPapua New GuineaParaguayPeruPhilippinesPolandPortugalPost-demographic dividendQatarRomaniaRussian FederationRwandaSamoaSan MarinoSao Tome and PrincipeSaudi ArabiaSerbiaSeychellesSierra LeoneSingaporeSlovak RepublicSloveniaSomaliaSouth AfricaSouth AsiaSouth Asia (IDA & IBRD)SpainSri LankaSt. LuciaSt. Vincent and the GrenadinesSudanSurinameSwazilandSwedenSwitzerlandSyrian Arab RepublicTajikistanTanzaniaThailandTongaTrinidad and TobagoTunisiaTurkeyTurkmenistanUgandaUkraineUnited Arab EmiratesUnited KingdomUnited StatesUpper middle incomeUruguayUzbekistanVenezuela, RBVietnamWorldYemen, Rep.ZambiaZimbabwe línea de tiempo (timeline):
En esta escala de tiempo se presenta un gráfico de 1964 y 2013 de Sudan. Los datos de 1963 están ausentes. El número de observaciones reales por fecha: 29.
Fuente (nombre):
Indicadores del desarrollo mundial
Fuente (organización):
World Intellectual Property Organization (WIPO), WIPO Patent Report: Statistics on Worldwide Patent Activity. The International Bureau of WIPO assumes no responsibility with respect to the transformation of these data.
Categorías:
Science & Technology
Se ha actualizado:
23 abr 2017 año
Los indicadores de los cambios de valor en los últimos años
Mínimo:
65.0
1 ene 1979 año
Máximo:
1.852 mil
1 ene 2003 año
A la fecha de observación
Valor
Cambio absoluto
El cambio con respecto al valor anterior
1 ene 1964 año
206.0
+206.0
0.0%
1 ene 1965 año
197.0
-9.0
-4.37%
1 ene 1966 año
111.0
-86.0
-43.65%
1 ene 1967 año
108.0
-3.0
-2.7%
1 ene 1968 año
287.0
+179.0
165.74%
1 ene 1970 año
263.0
-24.0
-8.36%
1 ene 1971 año
88.0
-175.0
-66.54%
1 ene 1974 año
74.0
-14.0
-15.91%
1 ene 1975 año
152.0
+78.0
105.41%
1 ene 1976 año
89.0
-63.0
-41.45%
1 ene 1977 año
87.0
-2.0
-2.25%
1 ene 1978 año
161.0
+74.0
85.06%
1 ene 1979 año
65.0
-96.0
-59.63%
1 ene 1980 año
86.0
+21.0
32.31%
1 ene 1981 año
139.0
+53.0
61.63%
1 ene 1983 año
135.0
-4.0
-2.88%
1 ene 1985 año
81.0
-54.0
-40.0%
1 ene 1986 año
113.0
+32.0
39.51%
1 ene 1999 año
738.0
+625.0
553.1%
1 ene 2000 año
1.07 mil
+332.0
44.99%
1 ene 2001 año
1.238 mil
+168.0
15.7%
1 ene 2002 año
805.0
-433.0
-34.98%
1 ene 2003 año
1.852 mil
+1.047 mil
130.06%
1 ene 2004 año
965.0
-887.0
-47.89%
1 ene 2005 año
1.067 mil
+102.0
10.57%
1 ene 2006 año
1.349 mil
+282.0
26.43%
1 ene 2007 año
1.81 mil
+461.0
34.17%
1 ene 2008 año
1.852 mil
+42.0
2.32%
1 ene 2013 año
851.0
-1.001 mil
-54.05%
Ranking de los países por los datos estadísticos actuales


Comentarios: