30
/es/
AIzaSyAYiBZKx7MnpbEhh9jyipgxe19OcubqV5w
April 1, 2024
165652
Jordan
JOR
true
2
1
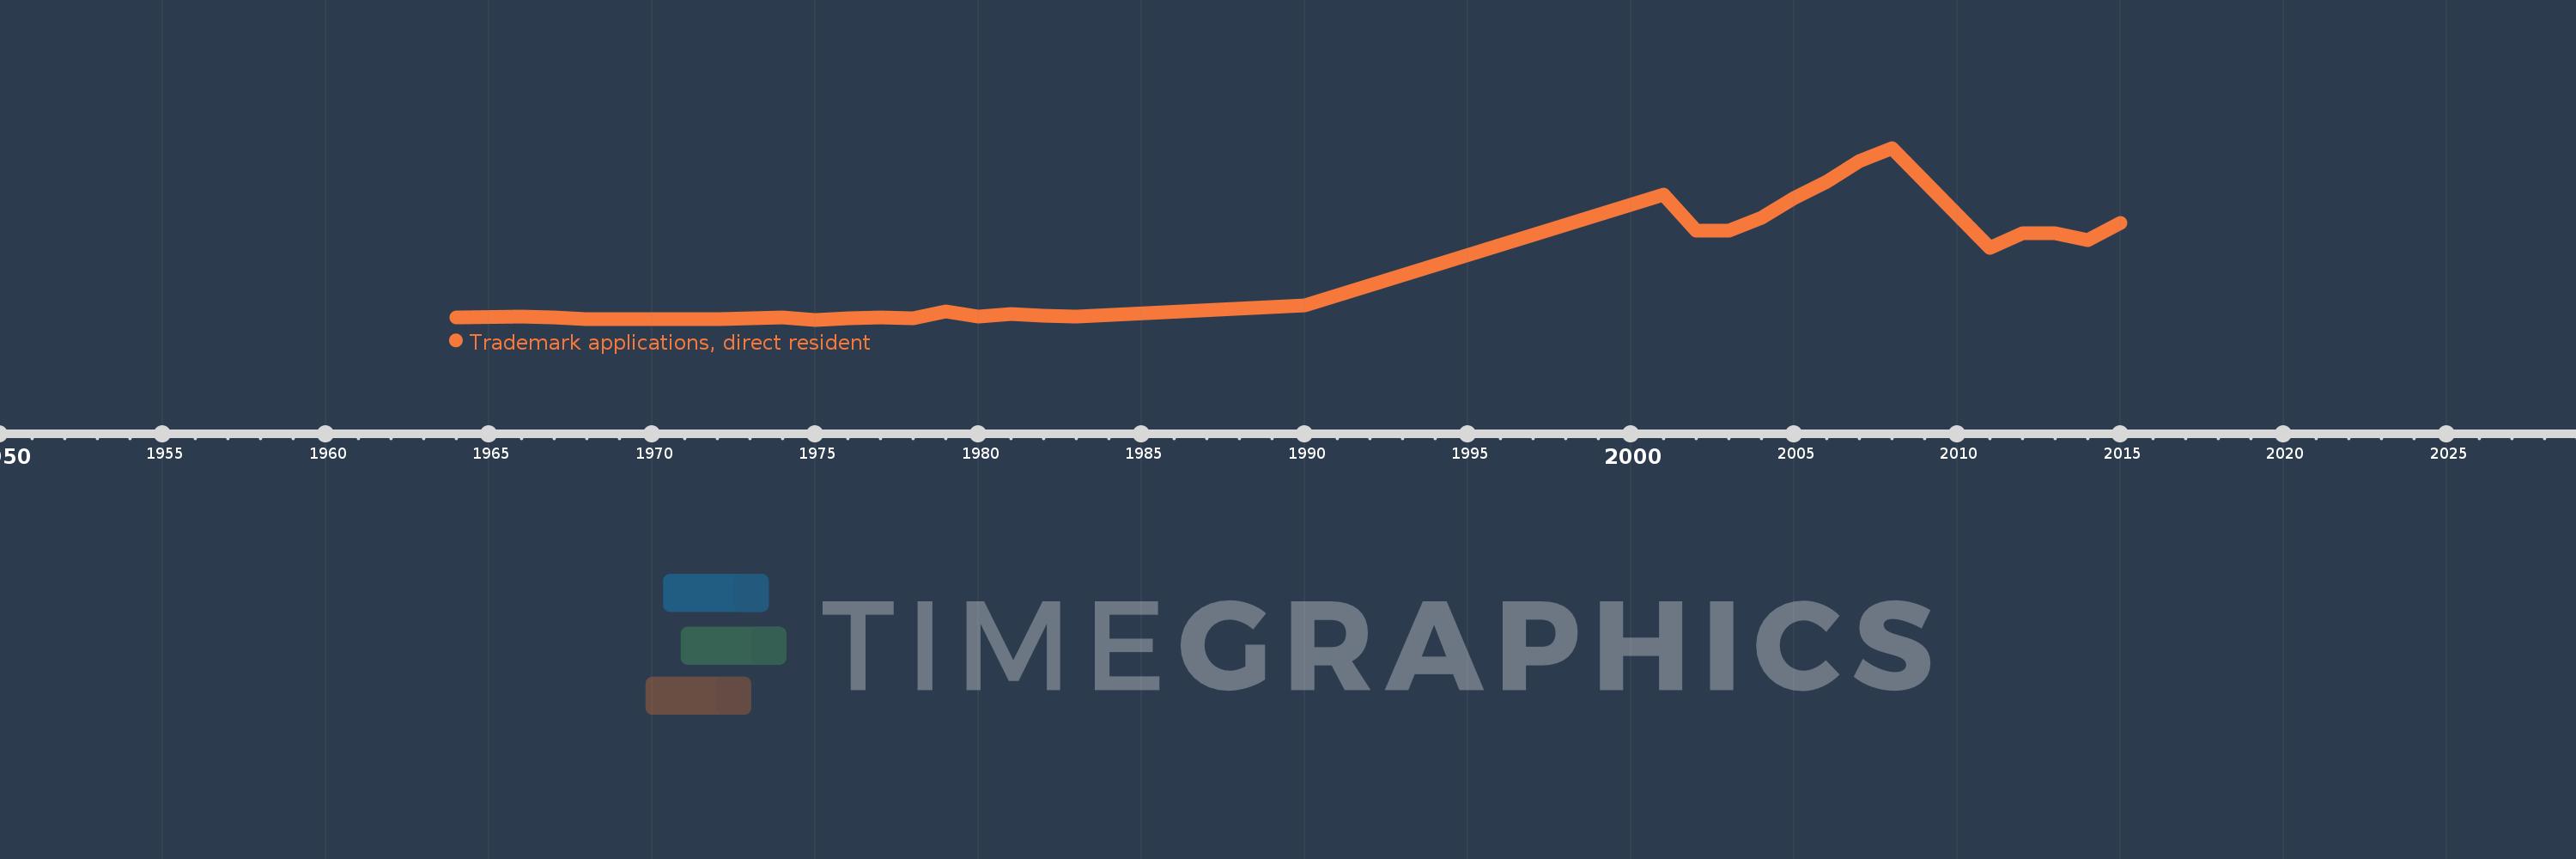
Trademark applications, direct resident
2015,2014,2013,2012,2011,2008,2007,2006,2005,2004,2003,2002,2001,1990,1983,1982,1981,1980,1979,1978,1977,1976,1975,1974,1973,1972,1970,1969,1968,1967,1966,1964
