29
/es/
es
AIzaSyAYiBZKx7MnpbEhh9jyipgxe19OcubqV5w
April 1, 2024
252561
St. Vincent and the Grenadines
VCT
true
2
1
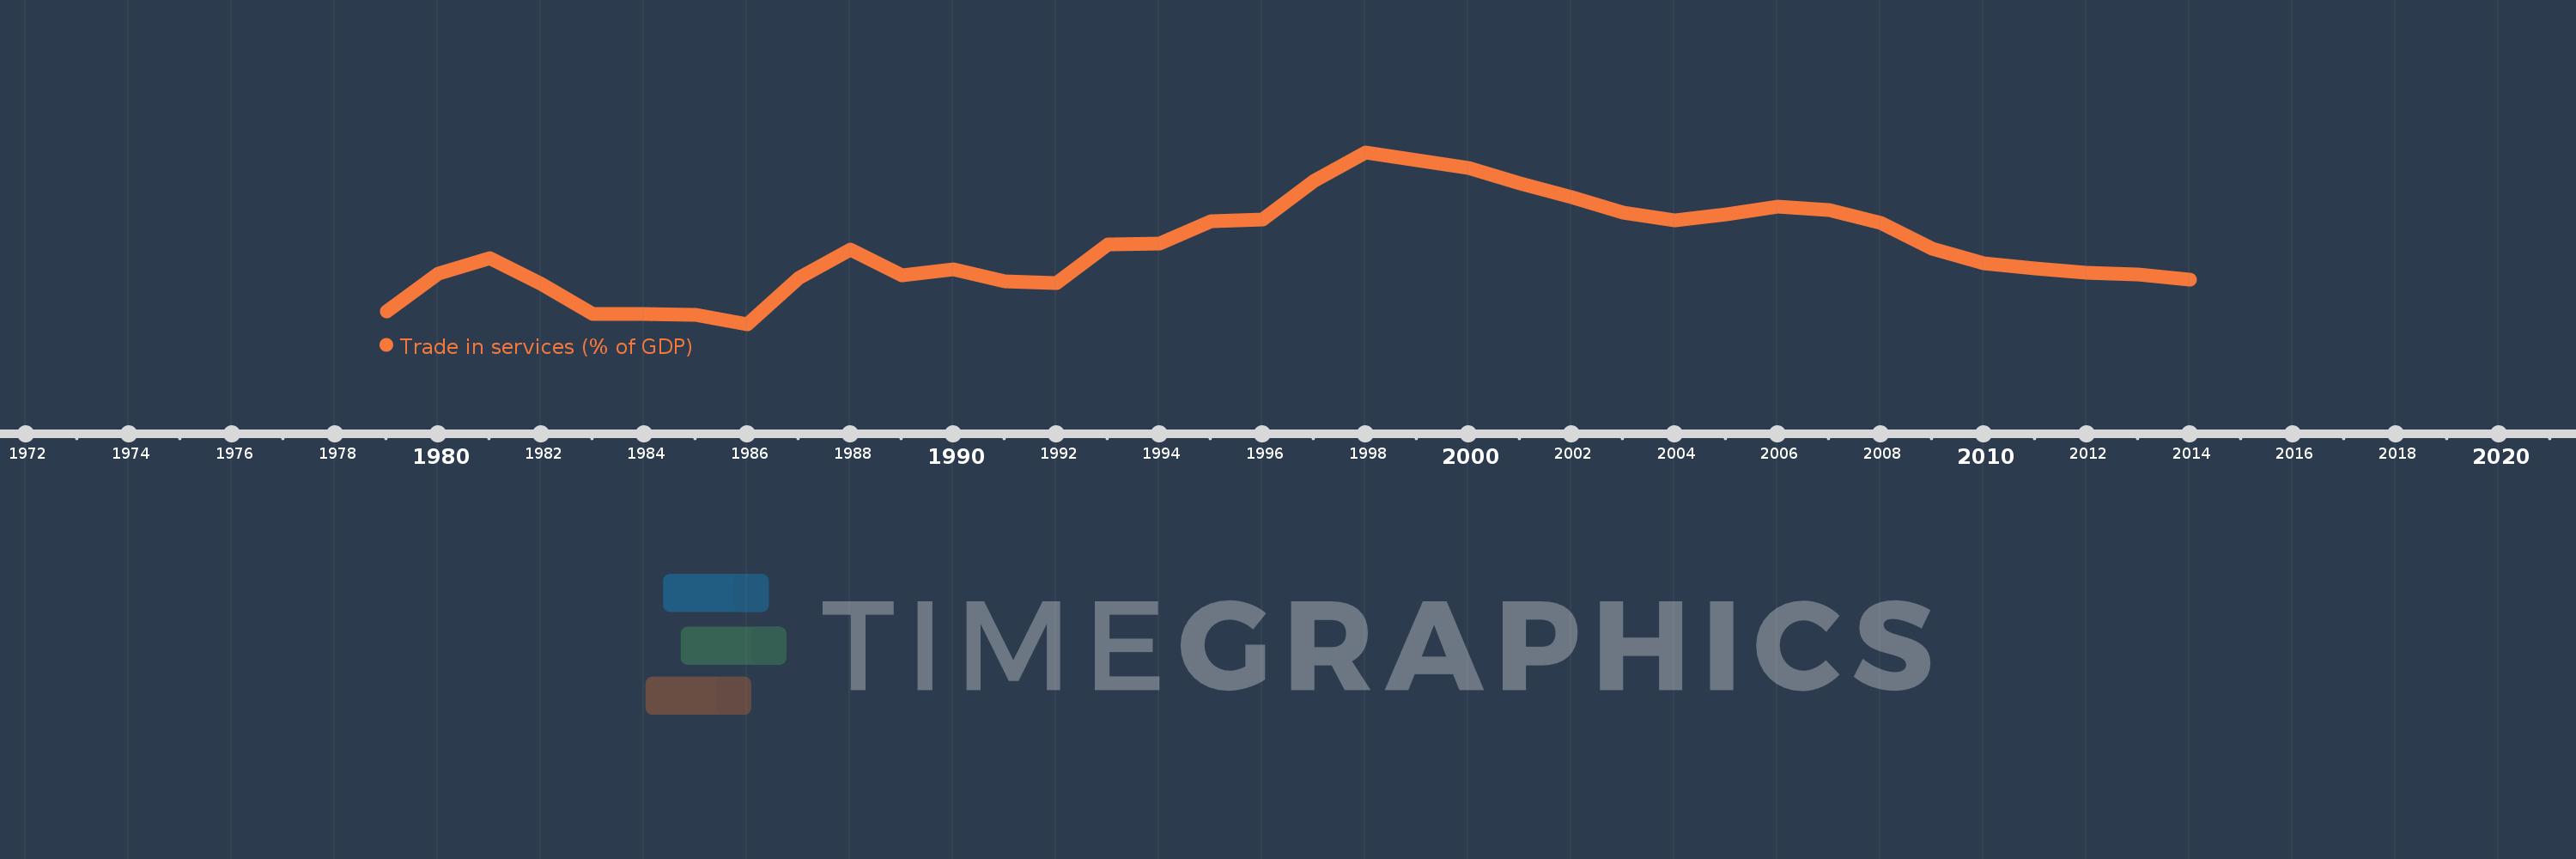
Trade in services (% of GDP)
2014,2013,2012,2011,2010,2009,2008,2007,2006,2005,2004,2003,2002,2001,2000,1999,1998,1997,1996,1995,1994,1993,1992,1991,1990,1989,1988,1987,1986,1985,1984,1983,1982,1981,1980,1979
Estas estadísticas en otros países:
AfghanistanAlbaniaAlgeriaAngolaAntigua and BarbudaArab WorldArgentinaArmeniaArubaAustraliaAustriaAzerbaijanBahamas, TheBahrainBangladeshBarbadosBelarusBelgiumBelizeBeninBermudaBhutanBoliviaBosnia and HerzegovinaBotswanaBrazilBrunei DarussalamBulgariaBurkina FasoBurundiCabo VerdeCambodiaCameroonCanadaCaribbean small statesCentral African RepublicCentral Europe and the BalticsChadChileChinaColombiaComorosCongo, Dem. Rep.Congo, Rep.Costa RicaCote d'IvoireCroatiaCyprusCzech RepublicDenmarkDjiboutiDominicaDominican RepublicEarly-demographic dividendEast Asia & PacificEast Asia & Pacific (excluding high income)East Asia & Pacific (IDA & IBRD countries)EcuadorEgypt, Arab Rep.El SalvadorEquatorial GuineaEritreaEstoniaEthiopiaEuro areaEurope & Central AsiaEurope & Central Asia (excluding high income)Europe & Central Asia (IDA & IBRD countries)European UnionFaroe IslandsFijiFinlandFragile and conflict affected situationsFranceGabonGambia, TheGeorgiaGermanyGhanaGreeceGrenadaGuatemalaGuineaGuinea-BissauGuyanaHaitiHeavily indebted poor countries (HIPC)High incomeHondurasHong Kong SAR, ChinaHungaryIBRD onlyIcelandIDA & IBRD totalIDA blendIDA onlyIDA totalIndiaIndonesiaIran, Islamic Rep.IraqIrelandIsraelItalyJamaicaJapanJordanKazakhstanKenyaKiribatiKorea, Rep.KosovoKuwaitKyrgyz RepublicLao PDRLate-demographic dividendLatin America & Caribbean Latin America & Caribbean (excluding high income)Latin America & the Caribbean (IDA & IBRD countries)LatviaLeast developed countries: UN classificationLebanonLesothoLiberiaLibyaLithuaniaLow & middle incomeLow incomeLower middle incomeLuxembourgMacao SAR, ChinaMacedonia, FYRMadagascarMalawiMalaysiaMaldivesMaliMaltaMarshall IslandsMauritaniaMauritiusMexicoMicronesia, Fed. Sts.Middle East & North AfricaMiddle East & North Africa (excluding high income)Middle East & North Africa (IDA & IBRD countries)Middle incomeMoldovaMongoliaMontenegroMoroccoMozambiqueMyanmarNamibiaNepalNetherlandsNew ZealandNicaraguaNigerNigeriaNorth AmericaNorwayOECD membersOmanOther small statesPacific island small statesPakistanPalauPanamaPapua New GuineaParaguayPeruPhilippinesPolandPortugalPost-demographic dividendPre-demographic dividendQatarRomaniaRussian FederationRwandaSamoaSao Tome and PrincipeSaudi ArabiaSenegalSerbiaSeychellesSierra LeoneSingaporeSlovak RepublicSloveniaSmall statesSolomon IslandsSouth AfricaSouth AsiaSouth Asia (IDA & IBRD)South SudanSpainSri LankaSt. Kitts and NevisSt. LuciaSt. Vincent and the GrenadinesSub-Saharan Africa Sub-Saharan Africa (excluding high income)Sub-Saharan Africa (IDA & IBRD countries)SudanSurinameSwazilandSwedenSwitzerlandSyrian Arab RepublicTajikistanTanzaniaThailandTimor-LesteTogoTongaTrinidad and TobagoTunisiaTurkeyTuvaluUgandaUkraineUnited KingdomUnited StatesUpper middle incomeUruguayVanuatuVenezuela, RBVietnamWest Bank and GazaWorldYemen, Rep.ZambiaZimbabwe línea de tiempo (timeline):
En esta escala de tiempo se presenta un gráfico de 1979 y 2014 de St. Vincent and the Grenadines. Los datos de 1978 están ausentes. El número de observaciones reales por fecha: 36.
Fuente (nombre):
Indicadores del desarrollo mundial
Fuente (organización):
International Monetary Fund, Balance of Payments Statistics Yearbook and data files, and World Bank and OECD GDP estimates.
Categorías:
Economy & Growth, Private Sector, Trade
Se ha actualizado:
23 abr 2017 año
Los indicadores de los cambios de valor en los últimos años
Mínimo:
25.486
1 ene 1986 año
Máximo:
51.009
1 ene 1998 año
A la fecha de observación
Valor
Cambio absoluto
El cambio con respecto al valor anterior
1 ene 1979 año
27.429
+27.429
0.0%
1 ene 1980 año
33.064
+5.636
20.55%
1 ene 1981 año
35.328
+2.263
6.85%
1 ene 1982 año
31.531
-3.797
-10.75%
1 ene 1983 año
26.997
-4.534
-14.38%
1 ene 1984 año
27.026
+0.029
0.11%
1 ene 1985 año
26.928
-0.098
-0.36%
1 ene 1986 año
25.486
-1.442
-5.35%
1 ene 1987 año
32.308
+6.822
26.77%
1 ene 1988 año
36.564
+4.256
13.17%
1 ene 1989 año
32.775
-3.789
-10.36%
1 ene 1990 año
33.618
+0.842
2.57%
1 ene 1991 año
31.876
-1.742
-5.18%
1 ene 1992 año
31.574
-0.302
-0.95%
1 ene 1993 año
37.33
+5.756
18.23%
1 ene 1994 año
37.431
+0.101
0.27%
1 ene 1995 año
40.78
+3.35
8.95%
1 ene 1996 año
40.985
+0.204
0.5%
1 ene 1997 año
46.728
+5.744
14.01%
1 ene 1998 año
51.009
+4.28
9.16%
1 ene 1999 año
49.884
-1.124
-2.2%
1 ene 2000 año
48.754
-1.13
-2.27%
1 ene 2001 año
46.378
-2.377
-4.87%
1 ene 2002 año
44.343
-2.035
-4.39%
1 ene 2003 año
42.032
-2.311
-5.21%
1 ene 2004 año
40.96
-1.072
-2.55%
1 ene 2005 año
41.85
+0.889
2.17%
1 ene 2006 año
42.994
+1.144
2.73%
1 ene 2007 año
42.406
-0.588
-1.37%
1 ene 2008 año
40.553
-1.854
-4.37%
1 ene 2009 año
36.686
-3.867
-9.54%
1 ene 2010 año
34.551
-2.135
-5.82%
1 ene 2011 año
33.711
-0.84
-2.43%
1 ene 2012 año
33.086
-0.624
-1.85%
1 ene 2013 año
32.841
-0.245
-0.74%
1 ene 2014 año
32.172
-0.67
-2.04%
Ranking de los países por los datos estadísticos actuales


Comentarios: