29
/es/
es
AIzaSyAYiBZKx7MnpbEhh9jyipgxe19OcubqV5w
April 1, 2024
154104
Iceland
ISL
true
2
1
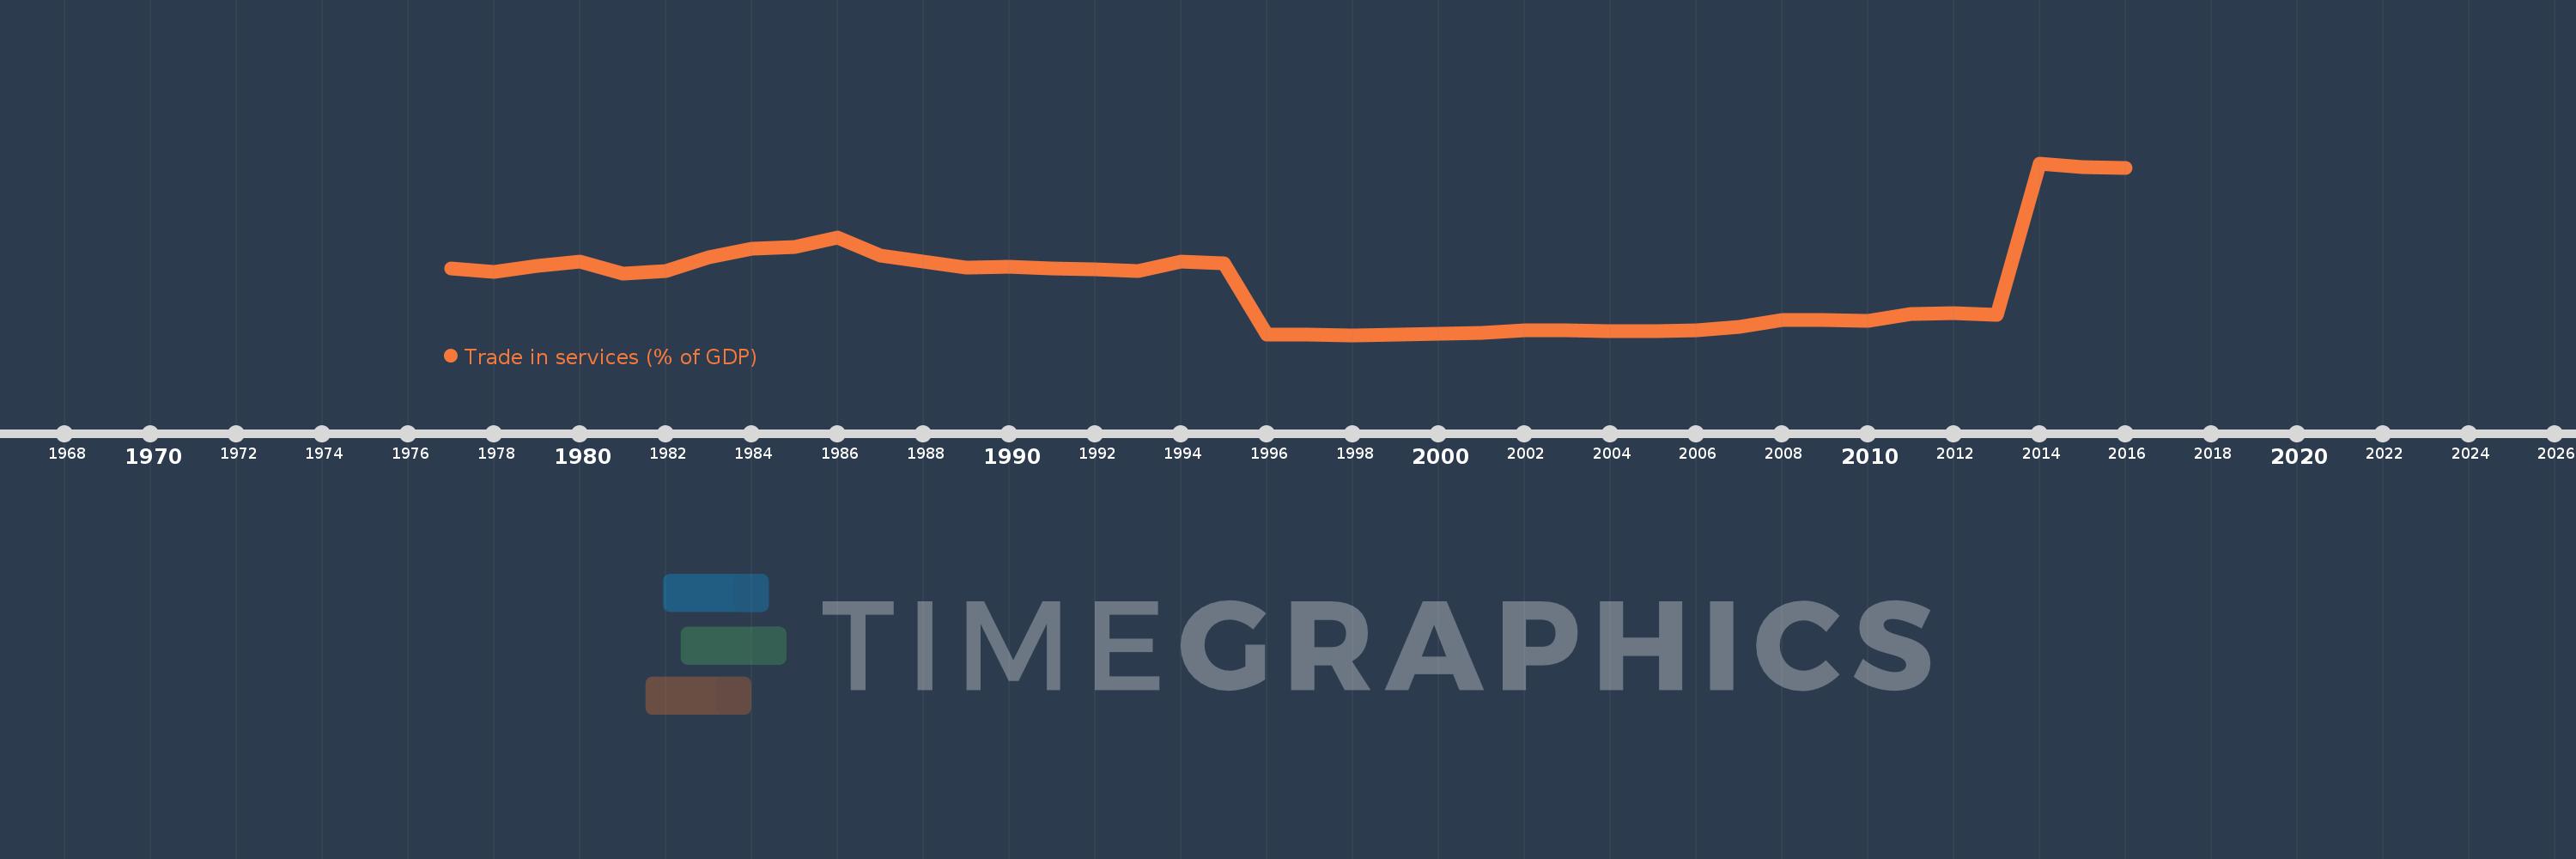
Trade in services (% of GDP)
2016,2015,2014,2013,2012,2011,2010,2009,2008,2007,2006,2005,2004,2003,2002,2001,2000,1999,1998,1997,1996,1995,1994,1993,1992,1991,1990,1989,1988,1987,1986,1985,1984,1983,1982,1981,1980,1979,1978,1977
Estas estadísticas en otros países:
AfghanistanAlbaniaAlgeriaAngolaAntigua and BarbudaArab WorldArgentinaArmeniaArubaAustraliaAustriaAzerbaijanBahamas, TheBahrainBangladeshBarbadosBelarusBelgiumBelizeBeninBermudaBhutanBoliviaBosnia and HerzegovinaBotswanaBrazilBrunei DarussalamBulgariaBurkina FasoBurundiCabo VerdeCambodiaCameroonCanadaCaribbean small statesCentral African RepublicCentral Europe and the BalticsChadChileChinaColombiaComorosCongo, Dem. Rep.Congo, Rep.Costa RicaCote d'IvoireCroatiaCyprusCzech RepublicDenmarkDjiboutiDominicaDominican RepublicEarly-demographic dividendEast Asia & PacificEast Asia & Pacific (excluding high income)East Asia & Pacific (IDA & IBRD countries)EcuadorEgypt, Arab Rep.El SalvadorEquatorial GuineaEritreaEstoniaEthiopiaEuro areaEurope & Central AsiaEurope & Central Asia (excluding high income)Europe & Central Asia (IDA & IBRD countries)European UnionFaroe IslandsFijiFinlandFragile and conflict affected situationsFranceGabonGambia, TheGeorgiaGermanyGhanaGreeceGrenadaGuatemalaGuineaGuinea-BissauGuyanaHaitiHeavily indebted poor countries (HIPC)High incomeHondurasHong Kong SAR, ChinaHungaryIBRD onlyIcelandIDA & IBRD totalIDA blendIDA onlyIDA totalIndiaIndonesiaIran, Islamic Rep.IraqIrelandIsraelItalyJamaicaJapanJordanKazakhstanKenyaKiribatiKorea, Rep.KosovoKuwaitKyrgyz RepublicLao PDRLate-demographic dividendLatin America & Caribbean Latin America & Caribbean (excluding high income)Latin America & the Caribbean (IDA & IBRD countries)LatviaLeast developed countries: UN classificationLebanonLesothoLiberiaLibyaLithuaniaLow & middle incomeLow incomeLower middle incomeLuxembourgMacao SAR, ChinaMacedonia, FYRMadagascarMalawiMalaysiaMaldivesMaliMaltaMarshall IslandsMauritaniaMauritiusMexicoMicronesia, Fed. Sts.Middle East & North AfricaMiddle East & North Africa (excluding high income)Middle East & North Africa (IDA & IBRD countries)Middle incomeMoldovaMongoliaMontenegroMoroccoMozambiqueMyanmarNamibiaNepalNetherlandsNew ZealandNicaraguaNigerNigeriaNorth AmericaNorwayOECD membersOmanOther small statesPacific island small statesPakistanPalauPanamaPapua New GuineaParaguayPeruPhilippinesPolandPortugalPost-demographic dividendPre-demographic dividendQatarRomaniaRussian FederationRwandaSamoaSao Tome and PrincipeSaudi ArabiaSenegalSerbiaSeychellesSierra LeoneSingaporeSlovak RepublicSloveniaSmall statesSolomon IslandsSouth AfricaSouth AsiaSouth Asia (IDA & IBRD)South SudanSpainSri LankaSt. Kitts and NevisSt. LuciaSt. Vincent and the GrenadinesSub-Saharan Africa Sub-Saharan Africa (excluding high income)Sub-Saharan Africa (IDA & IBRD countries)SudanSurinameSwazilandSwedenSwitzerlandSyrian Arab RepublicTajikistanTanzaniaThailandTimor-LesteTogoTongaTrinidad and TobagoTunisiaTurkeyTuvaluUgandaUkraineUnited KingdomUnited StatesUpper middle incomeUruguayVanuatuVenezuela, RBVietnamWest Bank and GazaWorldYemen, Rep.ZambiaZimbabwe línea de tiempo (timeline):
En esta escala de tiempo se presenta un gráfico de 1977 y 2016 de Iceland. Los datos de 1976 están ausentes. El número de observaciones reales por fecha: 40.
Fuente (nombre):
Indicadores del desarrollo mundial
Fuente (organización):
International Monetary Fund, Balance of Payments Statistics Yearbook and data files, and World Bank and OECD GDP estimates.
Categorías:
Economy & Growth, Private Sector, Trade
Se ha actualizado:
23 abr 2017 año
Los indicadores de los cambios de valor en los últimos años
Mínimo:
0.039
1 ene 1998 año
Máximo:
44.361
1 ene 2014 año
A la fecha de observación
Valor
Cambio absoluto
El cambio con respecto al valor anterior
1 ene 1977 año
17.212
+17.212
0.0%
1 ene 1978 año
16.254
-0.958
-5.57%
1 ene 1979 año
17.932
+1.678
10.32%
1 ene 1980 año
18.99
+1.058
5.9%
1 ene 1981 año
15.917
-3.074
-16.19%
1 ene 1982 año
16.607
+0.69
4.33%
1 ene 1983 año
20.079
+3.472
20.91%
1 ene 1984 año
22.349
+2.27
11.31%
1 ene 1985 año
22.785
+0.437
1.95%
1 ene 1986 año
25.169
+2.384
10.46%
1 ene 1987 año
20.556
-4.613
-18.33%
1 ene 1988 año
18.899
-1.657
-8.06%
1 ene 1989 año
17.335
-1.564
-8.28%
1 ene 1990 año
17.691
+0.356
2.05%
1 ene 1991 año
17.11
-0.58
-3.28%
1 ene 1992 año
16.93
-0.18
-1.05%
1 ene 1993 año
16.526
-0.404
-2.38%
1 ene 1994 año
19.021
+2.495
15.1%
1 ene 1995 año
18.574
-0.447
-2.35%
1 ene 1996 año
0.056
-18.518
-99.7%
1 ene 1997 año
0.063
+0.006
11.28%
1 ene 1998 año
0.039
-0.024
-38.16%
1 ene 1999 año
0.072
+0.033
85.92%
1 ene 2000 año
0.438
+0.366
509.51%
1 ene 2001 año
0.637
+0.199
45.43%
1 ene 2002 año
1.247
+0.61
95.72%
1 ene 2003 año
1.159
-0.088
-7.03%
1 ene 2004 año
1.032
-0.128
-11.02%
1 ene 2005 año
1.024
-0.007
-0.72%
1 ene 2006 año
1.214
+0.19
18.56%
1 ene 2007 año
2.123
+0.909
74.89%
1 ene 2008 año
3.823
+1.7
80.05%
1 ene 2009 año
3.909
+0.086
2.25%
1 ene 2010 año
3.624
-0.285
-7.29%
1 ene 2011 año
5.413
+1.789
49.37%
1 ene 2012 año
5.75
+0.337
6.22%
1 ene 2013 año
5.222
-0.528
-9.17%
1 ene 2014 año
44.361
+39.139
749.45%
1 ene 2015 año
43.455
-0.907
-2.04%
1 ene 2016 año
43.238
-0.217
-0.5%
Ranking de los países por los datos estadísticos actuales


Comentarios: