29
/es/
es
AIzaSyAYiBZKx7MnpbEhh9jyipgxe19OcubqV5w
April 1, 2024
249910
St. Kitts and Nevis
KNA
true
2
1
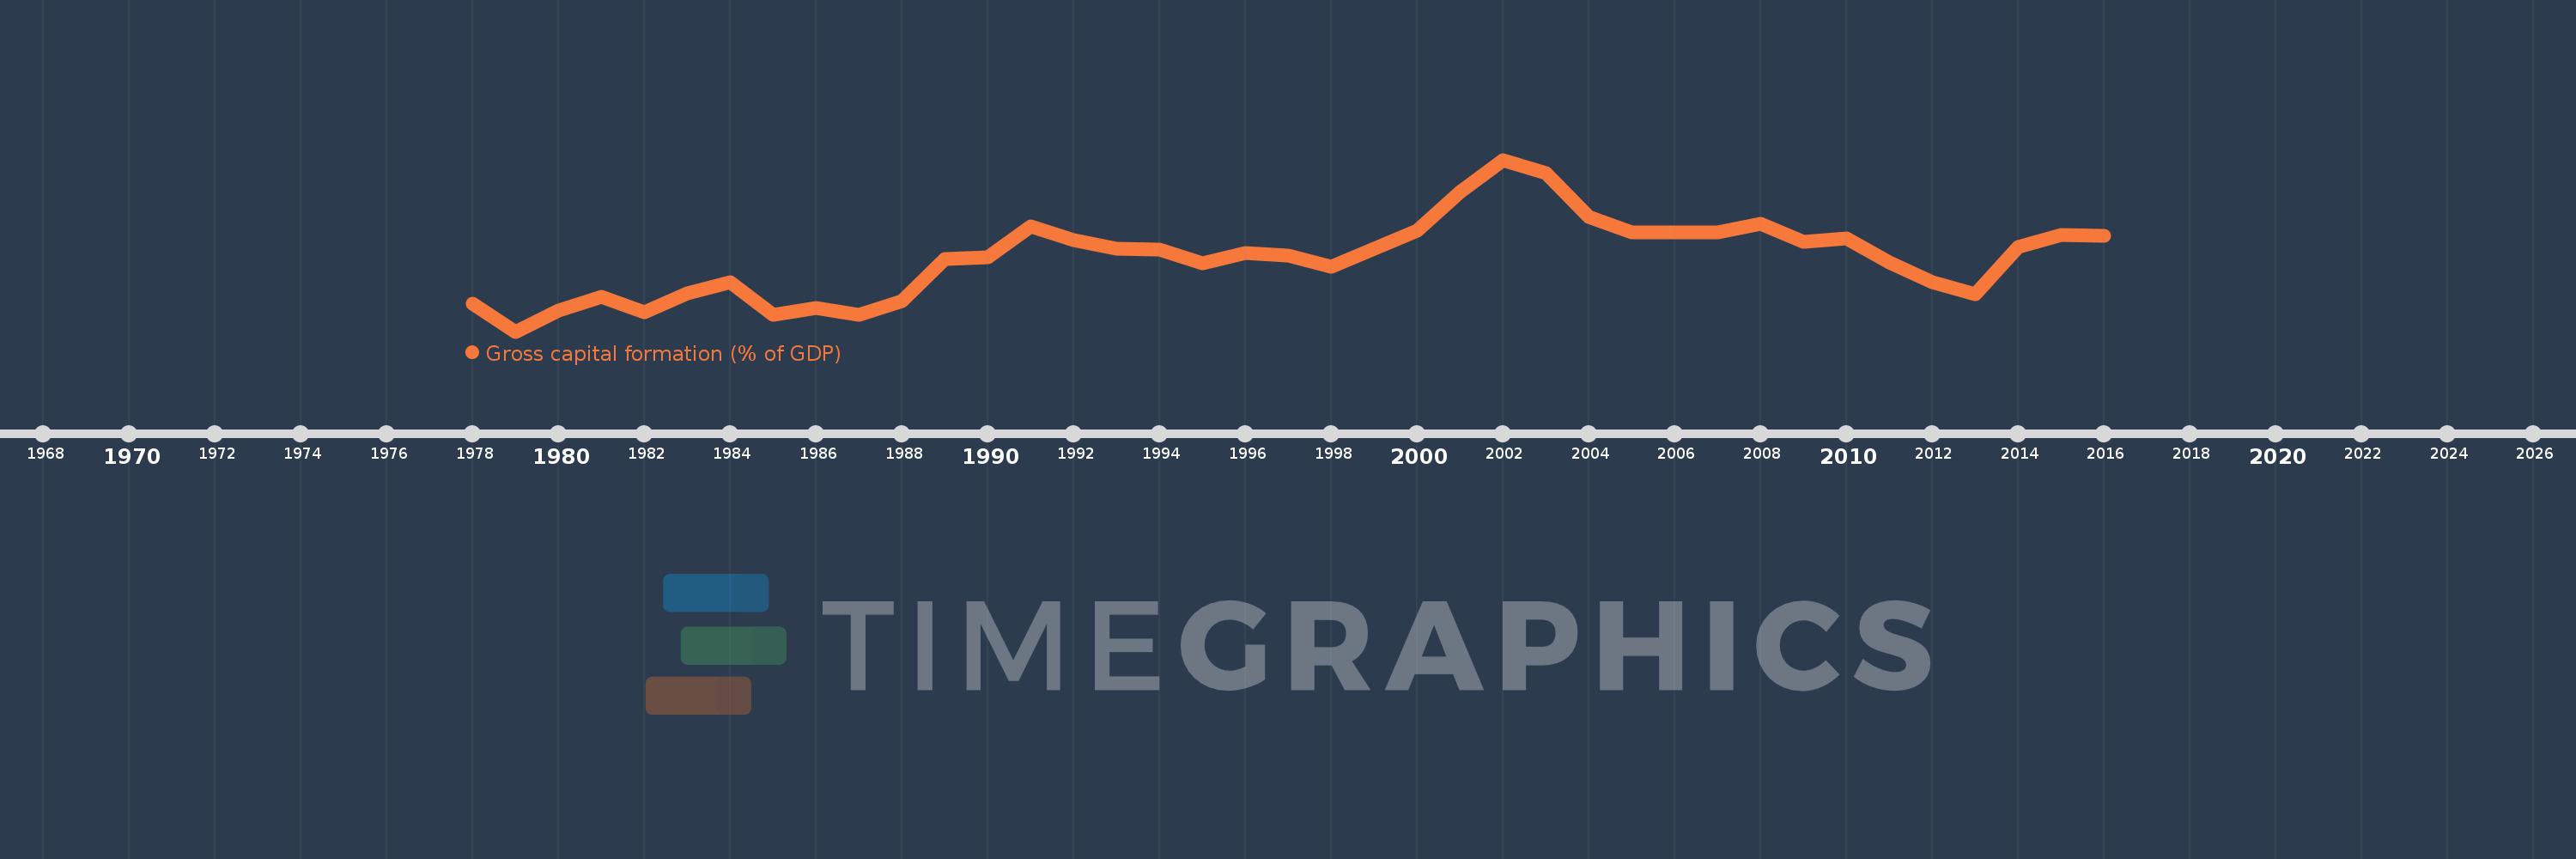
Gross capital formation (% of GDP)
2016,2015,2014,2013,2012,2011,2010,2009,2008,2007,2006,2005,2004,2003,2002,2001,2000,1999,1998,1997,1996,1995,1994,1993,1992,1991,1990,1989,1988,1987,1986,1985,1984,1983,1982,1981,1980,1979,1978
Estas estadísticas en otros países:
AfghanistanAlbaniaAlgeriaAngolaAntigua and BarbudaArab WorldArgentinaArmeniaArubaAustraliaAustriaAzerbaijanBahamas, TheBahrainBangladeshBarbadosBelarusBelgiumBelizeBeninBermudaBhutanBoliviaBosnia and HerzegovinaBotswanaBrazilBrunei DarussalamBulgariaBurkina FasoBurundiCabo VerdeCambodiaCameroonCanadaCaribbean small statesCentral African RepublicCentral Europe and the BalticsChadChileChinaColombiaComorosCongo, Dem. Rep.Congo, Rep.Costa RicaCote d'IvoireCroatiaCubaCyprusCzech RepublicDenmarkDjiboutiDominicaDominican RepublicEarly-demographic dividendEast Asia & PacificEast Asia & Pacific (excluding high income)East Asia & Pacific (IDA & IBRD countries)EcuadorEgypt, Arab Rep.El SalvadorEquatorial GuineaEritreaEstoniaEthiopiaEuro areaEurope & Central AsiaEurope & Central Asia (excluding high income)Europe & Central Asia (IDA & IBRD countries)European UnionFaroe IslandsFijiFinlandFragile and conflict affected situationsFranceGabonGambia, TheGeorgiaGermanyGhanaGreeceGrenadaGuatemalaGuineaGuinea-BissauGuyanaHaitiHeavily indebted poor countries (HIPC)High incomeHondurasHong Kong SAR, ChinaHungaryIBRD onlyIcelandIDA & IBRD totalIDA blendIDA onlyIDA totalIndiaIndonesiaIran, Islamic Rep.IraqIrelandIsraelItalyJamaicaJapanJordanKazakhstanKenyaKiribatiKorea, Rep.KosovoKuwaitKyrgyz RepublicLao PDRLate-demographic dividendLatin America & Caribbean Latin America & Caribbean (excluding high income)Latin America & the Caribbean (IDA & IBRD countries)LatviaLeast developed countries: UN classificationLebanonLesothoLiberiaLibyaLithuaniaLow & middle incomeLow incomeLower middle incomeLuxembourgMacao SAR, ChinaMacedonia, FYRMadagascarMalawiMalaysiaMaldivesMaliMaltaMauritaniaMauritiusMexicoMicronesia, Fed. Sts.Middle East & North AfricaMiddle East & North Africa (excluding high income)Middle East & North Africa (IDA & IBRD countries)Middle incomeMoldovaMongoliaMontenegroMoroccoMozambiqueNamibiaNepalNetherlandsNew CaledoniaNew ZealandNicaraguaNigerNigeriaNorth AmericaNorwayOECD membersOmanOther small statesPacific island small statesPakistanPanamaPapua New GuineaParaguayPeruPhilippinesPolandPortugalPost-demographic dividendPre-demographic dividendPuerto RicoQatarRomaniaRussian FederationRwandaSaudi ArabiaSenegalSerbiaSeychellesSierra LeoneSingaporeSlovak RepublicSloveniaSmall statesSolomon IslandsSomaliaSouth AfricaSouth AsiaSouth Asia (IDA & IBRD)South SudanSpainSri LankaSt. Kitts and NevisSt. LuciaSt. Vincent and the GrenadinesSub-Saharan Africa Sub-Saharan Africa (excluding high income)Sub-Saharan Africa (IDA & IBRD countries)SudanSurinameSwazilandSwedenSwitzerlandSyrian Arab RepublicTajikistanTanzaniaThailandTimor-LesteTogoTongaTrinidad and TobagoTunisiaTurkeyTurkmenistanUgandaUkraineUnited Arab EmiratesUnited KingdomUnited StatesUpper middle incomeUruguayUzbekistanVanuatuVenezuela, RBVietnamWest Bank and GazaWorldYemen, Rep.ZambiaZimbabwe línea de tiempo (timeline):
En esta escala de tiempo se presenta un gráfico de 1978 y 2016 de St. Kitts and Nevis. Los datos de 1977 están ausentes. El número de observaciones reales por fecha: 39.
Fuente (nombre):
Indicadores del desarrollo mundial
Fuente (organización):
World Bank national accounts data, and OECD National Accounts data files.
Categorías:
Economy & Growth
Se ha actualizado:
23 abr 2017 año
Los indicadores de los cambios de valor en los últimos años
Mínimo:
19.697
1 ene 1979 año
Máximo:
58.788
1 ene 2002 año
A la fecha de observación
Valor
Cambio absoluto
El cambio con respecto al valor anterior
1 ene 1978 año
25.987
+25.987
0.0%
1 ene 1979 año
19.697
-6.29
-24.2%
1 ene 1980 año
24.536
+4.839
24.57%
1 ene 1981 año
27.528
+2.992
12.19%
1 ene 1982 año
24.188
-3.34
-12.13%
1 ene 1983 año
28.394
+4.206
17.39%
1 ene 1984 año
30.97
+2.576
9.07%
1 ene 1985 año
23.551
-7.419
-23.95%
1 ene 1986 año
25.001
+1.449
6.15%
1 ene 1987 año
23.457
-1.543
-6.17%
1 ene 1988 año
26.696
+3.239
13.81%
1 ene 1989 año
36.31
+9.613
36.01%
1 ene 1990 año
36.53
+0.22
0.61%
1 ene 1991 año
43.66
+7.131
19.52%
1 ene 1992 año
40.443
-3.218
-7.37%
1 ene 1993 año
38.647
-1.795
-4.44%
1 ene 1994 año
38.358
-0.289
-0.75%
1 ene 1995 año
35.264
-3.094
-8.07%
1 ene 1996 año
37.535
+2.271
6.44%
1 ene 1997 año
37.055
-0.48
-1.28%
1 ene 1998 año
34.467
-2.588
-6.98%
1 ene 1999 año
38.583
+4.116
11.94%
1 ene 2000 año
42.629
+4.046
10.49%
1 ene 2001 año
51.51
+8.881
20.83%
1 ene 2002 año
58.788
+7.278
14.13%
1 ene 2003 año
55.73
-3.058
-5.2%
1 ene 2004 año
45.784
-9.946
-17.85%
1 ene 2005 año
42.177
-3.607
-7.88%
1 ene 2006 año
42.232
+0.055
0.13%
1 ene 2007 año
42.296
+0.064
0.15%
1 ene 2008 año
44.246
+1.949
4.61%
1 ene 2009 año
40.075
-4.171
-9.43%
1 ene 2010 año
40.976
+0.901
2.25%
1 ene 2011 año
35.335
-5.641
-13.77%
1 ene 2012 año
30.985
-4.35
-12.31%
1 ene 2013 año
28.17
-2.815
-9.09%
1 ene 2014 año
38.967
+10.797
38.33%
1 ene 2015 año
41.695
+2.728
7.0%
1 ene 2016 año
41.523
-0.172
-0.41%
Ranking de los países por los datos estadísticos actuales


Comentarios: