29
/es/
es
AIzaSyAYiBZKx7MnpbEhh9jyipgxe19OcubqV5w
April 1, 2024
164882
Jordan
JOR
true
2
1
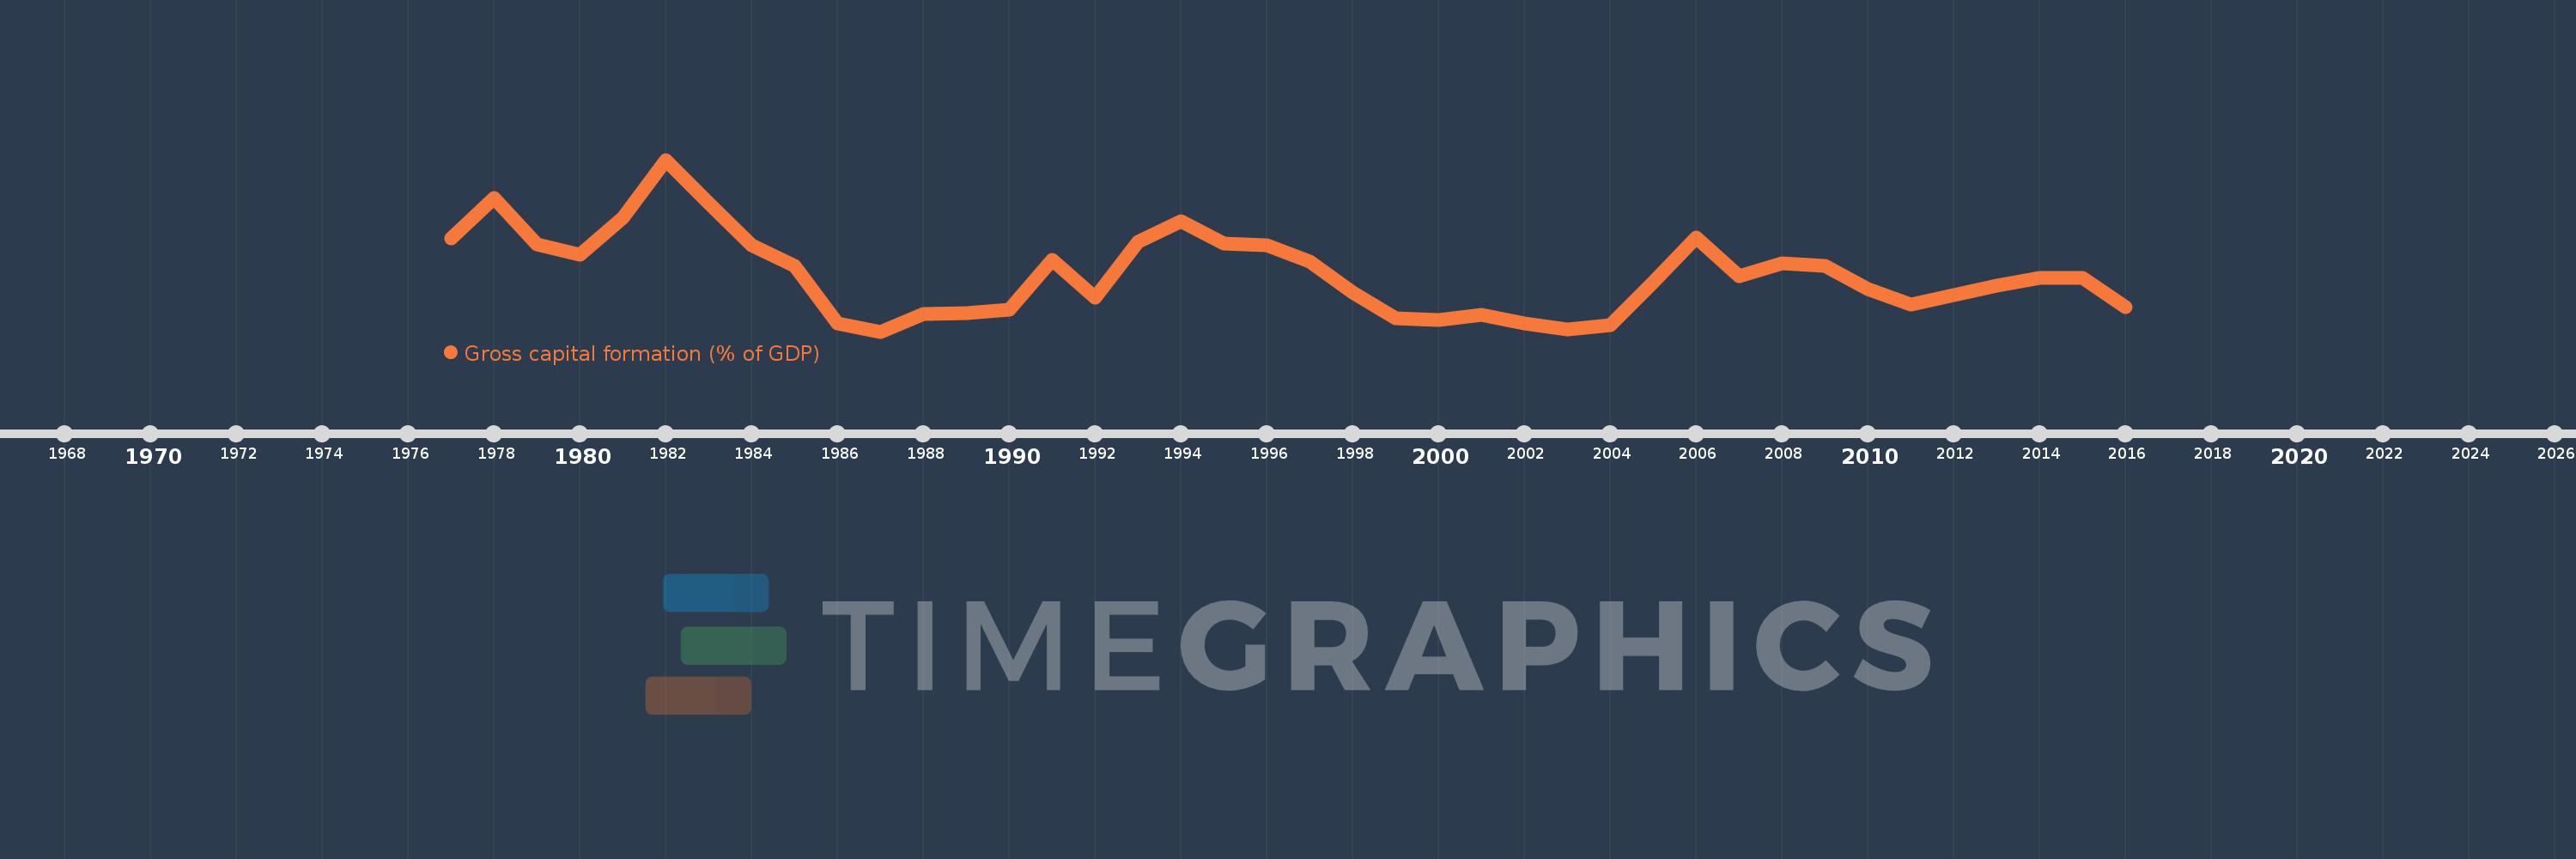
Gross capital formation (% of GDP)
2016,2015,2014,2013,2012,2011,2010,2009,2008,2007,2006,2005,2004,2003,2002,2001,2000,1999,1998,1997,1996,1995,1994,1993,1992,1991,1990,1989,1988,1987,1986,1985,1984,1983,1982,1981,1980,1979,1978,1977
Estas estadísticas en otros países:
AfghanistanAlbaniaAlgeriaAngolaAntigua and BarbudaArab WorldArgentinaArmeniaArubaAustraliaAustriaAzerbaijanBahamas, TheBahrainBangladeshBarbadosBelarusBelgiumBelizeBeninBermudaBhutanBoliviaBosnia and HerzegovinaBotswanaBrazilBrunei DarussalamBulgariaBurkina FasoBurundiCabo VerdeCambodiaCameroonCanadaCaribbean small statesCentral African RepublicCentral Europe and the BalticsChadChileChinaColombiaComorosCongo, Dem. Rep.Congo, Rep.Costa RicaCote d'IvoireCroatiaCubaCyprusCzech RepublicDenmarkDjiboutiDominicaDominican RepublicEarly-demographic dividendEast Asia & PacificEast Asia & Pacific (excluding high income)East Asia & Pacific (IDA & IBRD countries)EcuadorEgypt, Arab Rep.El SalvadorEquatorial GuineaEritreaEstoniaEthiopiaEuro areaEurope & Central AsiaEurope & Central Asia (excluding high income)Europe & Central Asia (IDA & IBRD countries)European UnionFaroe IslandsFijiFinlandFragile and conflict affected situationsFranceGabonGambia, TheGeorgiaGermanyGhanaGreeceGrenadaGuatemalaGuineaGuinea-BissauGuyanaHaitiHeavily indebted poor countries (HIPC)High incomeHondurasHong Kong SAR, ChinaHungaryIBRD onlyIcelandIDA & IBRD totalIDA blendIDA onlyIDA totalIndiaIndonesiaIran, Islamic Rep.IraqIrelandIsraelItalyJamaicaJapanJordanKazakhstanKenyaKiribatiKorea, Rep.KosovoKuwaitKyrgyz RepublicLao PDRLate-demographic dividendLatin America & Caribbean Latin America & Caribbean (excluding high income)Latin America & the Caribbean (IDA & IBRD countries)LatviaLeast developed countries: UN classificationLebanonLesothoLiberiaLibyaLithuaniaLow & middle incomeLow incomeLower middle incomeLuxembourgMacao SAR, ChinaMacedonia, FYRMadagascarMalawiMalaysiaMaldivesMaliMaltaMauritaniaMauritiusMexicoMicronesia, Fed. Sts.Middle East & North AfricaMiddle East & North Africa (excluding high income)Middle East & North Africa (IDA & IBRD countries)Middle incomeMoldovaMongoliaMontenegroMoroccoMozambiqueNamibiaNepalNetherlandsNew CaledoniaNew ZealandNicaraguaNigerNigeriaNorth AmericaNorwayOECD membersOmanOther small statesPacific island small statesPakistanPanamaPapua New GuineaParaguayPeruPhilippinesPolandPortugalPost-demographic dividendPre-demographic dividendPuerto RicoQatarRomaniaRussian FederationRwandaSaudi ArabiaSenegalSerbiaSeychellesSierra LeoneSingaporeSlovak RepublicSloveniaSmall statesSolomon IslandsSomaliaSouth AfricaSouth AsiaSouth Asia (IDA & IBRD)South SudanSpainSri LankaSt. Kitts and NevisSt. LuciaSt. Vincent and the GrenadinesSub-Saharan Africa Sub-Saharan Africa (excluding high income)Sub-Saharan Africa (IDA & IBRD countries)SudanSurinameSwazilandSwedenSwitzerlandSyrian Arab RepublicTajikistanTanzaniaThailandTimor-LesteTogoTongaTrinidad and TobagoTunisiaTurkeyTurkmenistanUgandaUkraineUnited Arab EmiratesUnited KingdomUnited StatesUpper middle incomeUruguayUzbekistanVanuatuVenezuela, RBVietnamWest Bank and GazaWorldYemen, Rep.ZambiaZimbabwe línea de tiempo (timeline):
En esta escala de tiempo se presenta un gráfico de 1977 y 2016 de Jordan. Los datos de 1976 están ausentes. El número de observaciones reales por fecha: 40.
Fuente (nombre):
Indicadores del desarrollo mundial
Fuente (organización):
World Bank national accounts data, and OECD National Accounts data files.
Categorías:
Economy & Growth
Se ha actualizado:
23 abr 2017 año
Los indicadores de los cambios de valor en los últimos años
Mínimo:
19.834
1 ene 1987 año
Máximo:
46.027
1 ene 1982 año
A la fecha de observación
Valor
Cambio absoluto
El cambio con respecto al valor anterior
1 ene 1977 año
34.091
+34.091
0.0%
1 ene 1978 año
40.252
+6.161
18.07%
1 ene 1979 año
33.078
-7.174
-17.82%
1 ene 1980 año
31.542
-1.536
-4.64%
1 ene 1981 año
37.174
+5.632
17.85%
1 ene 1982 año
46.027
+8.854
23.82%
1 ene 1983 año
39.445
-6.583
-14.3%
1 ene 1984 año
33.012
-6.432
-16.31%
1 ene 1985 año
29.91
-3.102
-9.4%
1 ene 1986 año
21.053
-8.857
-29.61%
1 ene 1987 año
19.834
-1.219
-5.79%
1 ene 1988 año
22.55
+2.716
13.69%
1 ene 1989 año
22.662
+0.112
0.5%
1 ene 1990 año
23.236
+0.574
2.53%
1 ene 1991 año
30.797
+7.561
32.54%
1 ene 1992 año
24.966
-5.83
-18.93%
1 ene 1993 año
33.476
+8.51
34.09%
1 ene 1994 año
36.627
+3.151
9.41%
1 ene 1995 año
33.293
-3.334
-9.1%
1 ene 1996 año
32.964
-0.329
-0.99%
1 ene 1997 año
30.524
-2.44
-7.4%
1 ene 1998 año
25.733
-4.791
-15.7%
1 ene 1999 año
21.824
-3.909
-15.19%
1 ene 2000 año
21.575
-0.249
-1.14%
1 ene 2001 año
22.369
+0.794
3.68%
1 ene 2002 año
21.062
-1.306
-5.84%
1 ene 2003 año
20.101
-0.962
-4.57%
1 ene 2004 año
20.845
+0.745
3.71%
1 ene 2005 año
27.394
+6.548
31.41%
1 ene 2006 año
34.149
+6.755
24.66%
1 ene 2007 año
28.34
-5.809
-17.01%
1 ene 2008 año
30.268
+1.928
6.8%
1 ene 2009 año
29.895
-0.373
-1.23%
1 ene 2010 año
26.302
-3.593
-12.02%
1 ene 2011 año
24.021
-2.281
-8.67%
1 ene 2012 año
25.454
+1.433
5.97%
1 ene 2013 año
26.897
+1.443
5.67%
1 ene 2014 año
28.056
+1.159
4.31%
1 ene 2015 año
27.97
-0.086
-0.31%
1 ene 2016 año
23.611
-4.36
-15.59%
Ranking de los países por los datos estadísticos actuales


Comentarios: