29
/es/
es
AIzaSyAYiBZKx7MnpbEhh9jyipgxe19OcubqV5w
April 1, 2024
241481
Slovak Republic
SVK
true
2
1
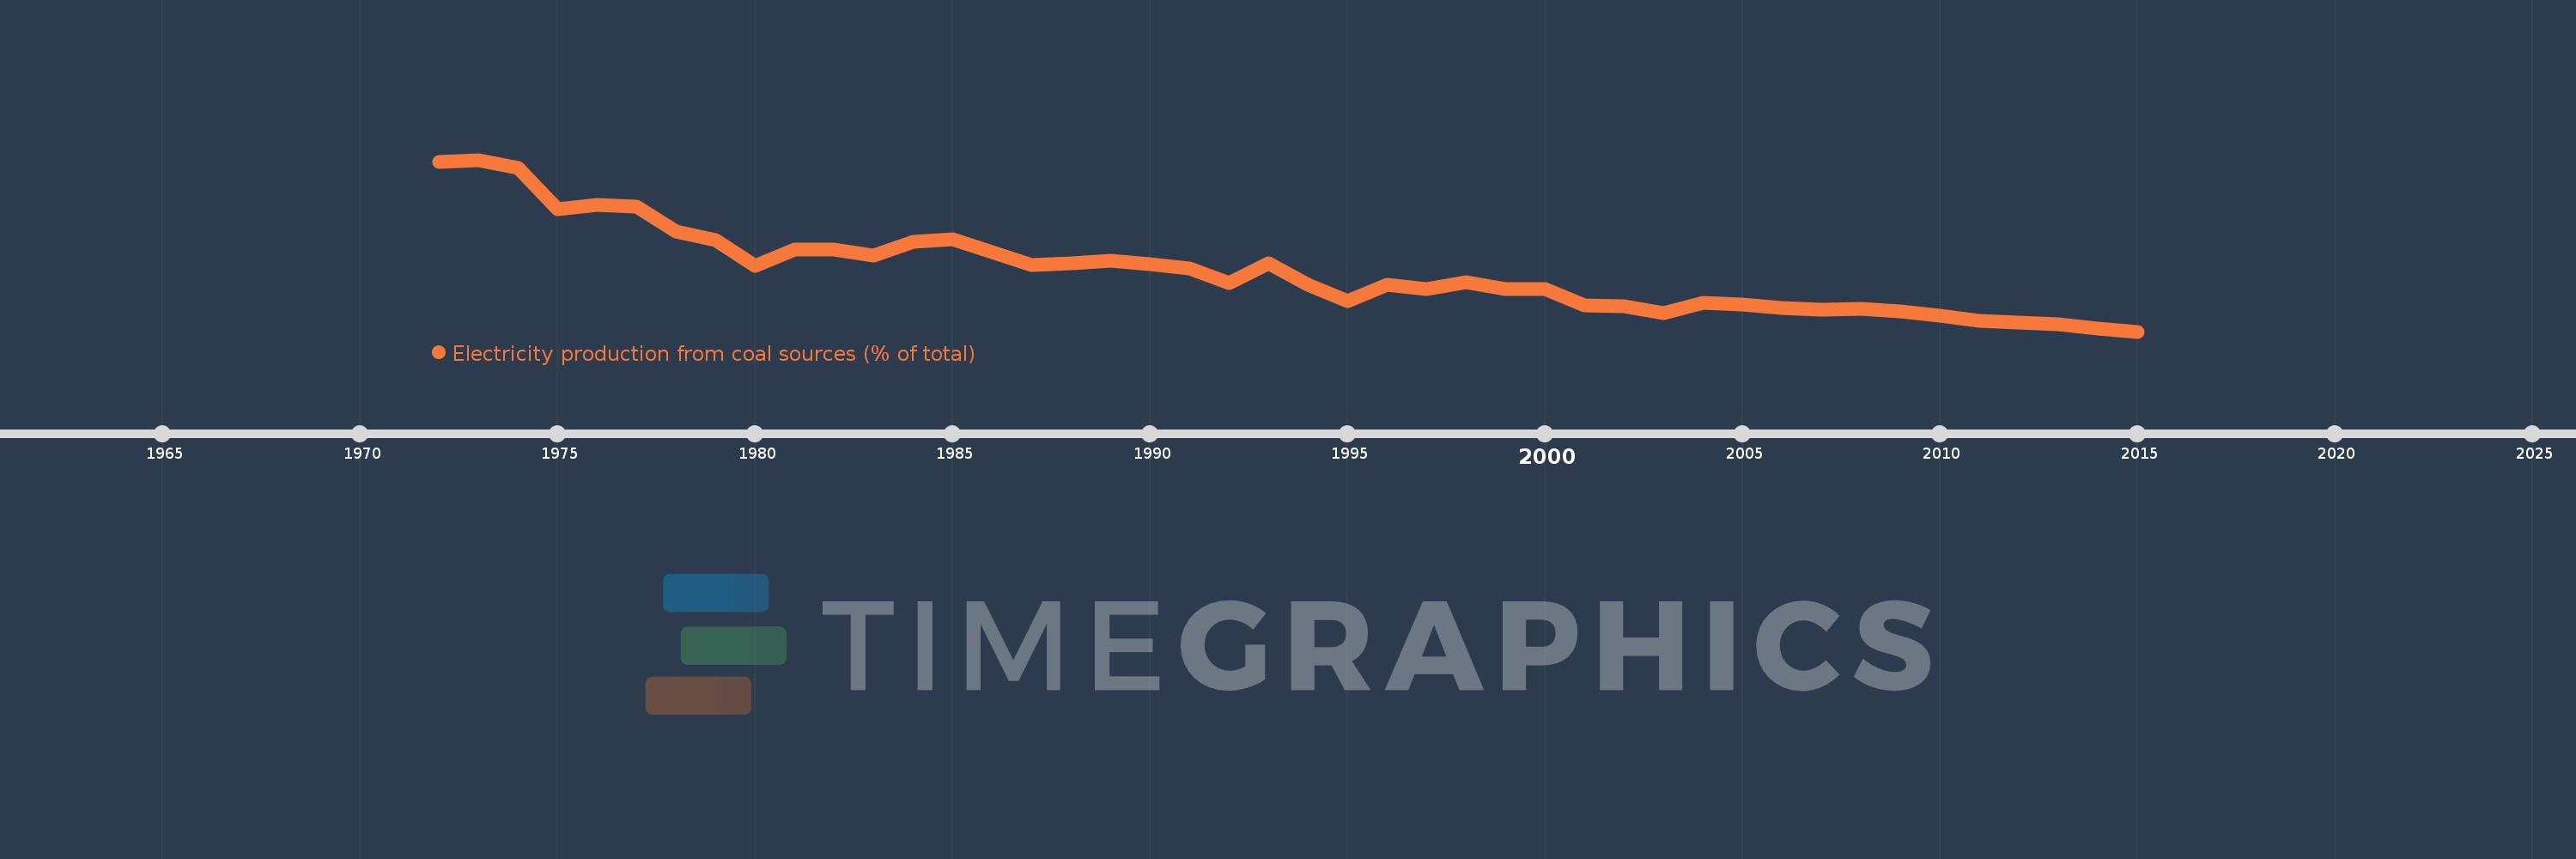
Electricity production from coal sources (% of total)
2015,2014,2013,2012,2011,2010,2009,2008,2007,2006,2005,2004,2003,2002,2001,2000,1999,1998,1997,1996,1995,1994,1993,1992,1991,1990,1989,1988,1987,1986,1985,1984,1983,1982,1981,1980,1979,1978,1977,1976,1975,1974,1973,1972
Estas estadísticas en otros países:
AlbaniaAlgeriaAngolaArab WorldArgentinaArmeniaAustraliaAustriaAzerbaijanBahrainBangladeshBelarusBelgiumBeninBoliviaBosnia and HerzegovinaBotswanaBrazilBrunei DarussalamBulgariaCambodiaCameroonCanadaCentral Europe and the BalticsChileChinaColombiaCongo, Dem. Rep.Congo, Rep.Costa RicaCote d'IvoireCroatiaCubaCuracaoCyprusCzech RepublicDenmarkDominican RepublicEarly-demographic dividendEast Asia & PacificEast Asia & Pacific (excluding high income)East Asia & Pacific (IDA & IBRD countries)EcuadorEgypt, Arab Rep.El SalvadorEritreaEstoniaEthiopiaEuro areaEurope & Central AsiaEurope & Central Asia (excluding high income)Europe & Central Asia (IDA & IBRD countries)European UnionFinlandFragile and conflict affected situationsFranceGabonGeorgiaGermanyGhanaGibraltarGreeceGuatemalaHaitiHeavily indebted poor countries (HIPC)High incomeHondurasHong Kong SAR, ChinaHungaryIBRD onlyIcelandIDA & IBRD totalIDA blendIDA onlyIDA totalIndiaIndonesiaIran, Islamic Rep.IraqIrelandIsraelItalyJamaicaJapanJordanKazakhstanKenyaKorea, Dem. People’s Rep.Korea, Rep.KosovoKuwaitKyrgyz RepublicLate-demographic dividendLatin America & Caribbean Latin America & Caribbean (excluding high income)Latin America & the Caribbean (IDA & IBRD countries)LatviaLeast developed countries: UN classificationLebanonLibyaLithuaniaLow & middle incomeLower middle incomeLuxembourgMacedonia, FYRMalaysiaMaltaMauritiusMexicoMiddle East & North AfricaMiddle East & North Africa (excluding high income)Middle East & North Africa (IDA & IBRD countries)Middle incomeMoldovaMongoliaMontenegroMoroccoMozambiqueMyanmarNamibiaNepalNetherlandsNew ZealandNicaraguaNigerNigeriaNorth AmericaNorwayOECD membersOmanOther small statesPakistanPanamaParaguayPeruPhilippinesPolandPortugalPost-demographic dividendPre-demographic dividendQatarRomaniaRussian FederationSaudi ArabiaSenegalSerbiaSingaporeSlovak RepublicSloveniaSmall statesSouth AfricaSouth AsiaSouth Asia (IDA & IBRD)South SudanSpainSri LankaSub-Saharan Africa Sub-Saharan Africa (excluding high income)Sub-Saharan Africa (IDA & IBRD countries)SudanSwedenSwitzerlandSyrian Arab RepublicTajikistanTanzaniaThailandTogoTrinidad and TobagoTunisiaTurkeyTurkmenistanUkraineUnited Arab EmiratesUnited KingdomUnited StatesUpper middle incomeUruguayUzbekistanVenezuela, RBVietnamWorldYemen, Rep.ZambiaZimbabwe línea de tiempo (timeline):
En esta escala de tiempo se presenta un gráfico de 1972 y 2015 de Slovak Republic. Los datos de 1971 están ausentes. El número de observaciones reales por fecha: 44.
Fuente (nombre):
Indicadores del desarrollo mundial
Fuente (organización):
IEA Statistics © OECD/IEA 2014 (http://www.iea.org/stats/index.asp), subject to https://www.iea.org/t&c/termsandconditions/
Categorías:
Energy & Mining, Climate Change, Infrastructure
Se ha actualizado:
23 abr 2017 año
Los indicadores de los cambios de valor en los últimos años
Mínimo:
11.307
1 ene 2015 año
Máximo:
67.013
1 ene 1973 año
A la fecha de observación
Valor
Cambio absoluto
El cambio con respecto al valor anterior
1 ene 1972 año
66.341
+66.341
0.0%
1 ene 1973 año
67.013
+0.672
1.01%
1 ene 1974 año
64.395
-2.618
-3.91%
1 ene 1975 año
51.071
-13.325
-20.69%
1 ene 1976 año
52.487
+1.416
2.77%
1 ene 1977 año
51.815
-0.672
-1.28%
1 ene 1978 año
43.621
-8.195
-15.81%
1 ene 1979 año
40.863
-2.757
-6.32%
1 ene 1980 año
32.666
-8.197
-20.06%
1 ene 1981 año
37.862
+5.196
15.91%
1 ene 1982 año
37.838
-0.024
-0.06%
1 ene 1983 año
35.858
-1.98
-5.23%
1 ene 1984 año
40.453
+4.595
12.81%
1 ene 1985 año
41.365
+0.911
2.25%
1 ene 1986 año
37.152
-4.213
-10.18%
1 ene 1987 año
32.918
-4.234
-11.4%
1 ene 1988 año
33.362
+0.445
1.35%
1 ene 1989 año
34.421
+1.059
3.17%
1 ene 1990 año
33.167
-1.254
-3.64%
1 ene 1991 año
31.859
-1.308
-3.94%
1 ene 1992 año
27.002
-4.856
-15.24%
1 ene 1993 año
33.57
+6.568
24.32%
1 ene 1994 año
26.422
-7.148
-21.29%
1 ene 1995 año
21.07
-5.352
-20.26%
1 ene 1996 año
26.449
+5.379
25.53%
1 ene 1997 año
25.214
-1.235
-4.67%
1 ene 1998 año
27.402
+2.188
8.68%
1 ene 1999 año
25.171
-2.231
-8.14%
1 ene 2000 año
25.23
+0.059
0.24%
1 ene 2001 año
19.842
-5.388
-21.36%
1 ene 2002 año
19.642
-0.201
-1.01%
1 ene 2003 año
17.379
-2.263
-11.52%
1 ene 2004 año
20.664
+3.286
18.91%
1 ene 2005 año
20.076
-0.589
-2.85%
1 ene 2006 año
19.074
-1.002
-4.99%
1 ene 2007 año
18.332
-0.742
-3.89%
1 ene 2008 año
18.726
+0.394
2.15%
1 ene 2009 año
17.903
-0.822
-4.39%
1 ene 2010 año
16.498
-1.406
-7.85%
1 ene 2011 año
14.856
-1.642
-9.95%
1 ene 2012 año
14.275
-0.581
-3.91%
1 ene 2013 año
13.788
-0.486
-3.41%
1 ene 2014 año
12.366
-1.423
-10.32%
1 ene 2015 año
11.307
-1.059
-8.56%
Ranking de los países por los datos estadísticos actuales


Comentarios: