29
/es/
es
AIzaSyAYiBZKx7MnpbEhh9jyipgxe19OcubqV5w
April 1, 2024
155859
Indonesia
IDN
true
2
1
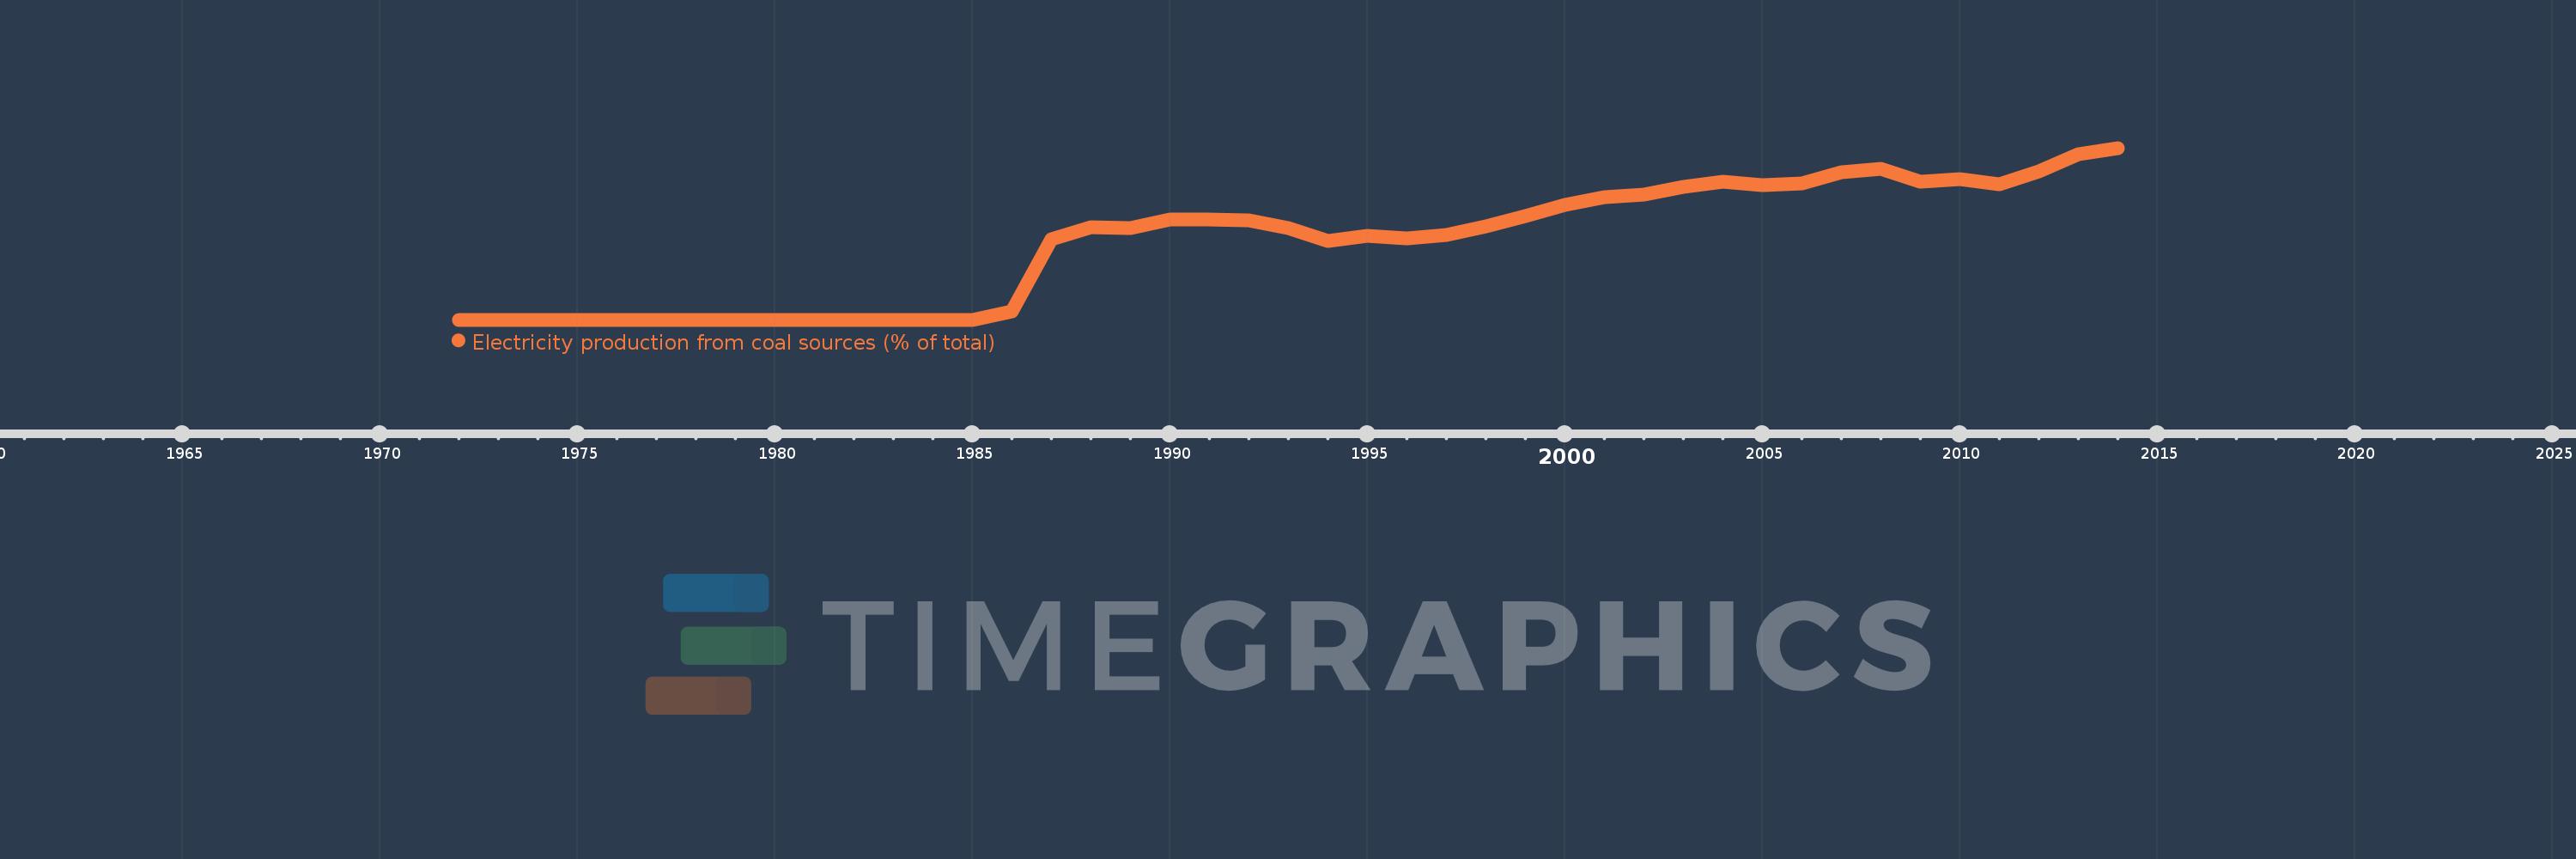
Electricity production from coal sources (% of total)
2014,2013,2012,2011,2010,2009,2008,2007,2006,2005,2004,2003,2002,2001,2000,1999,1998,1997,1996,1995,1994,1993,1992,1991,1990,1989,1988,1987,1986,1985,1984,1983,1982,1981,1980,1979,1978,1977,1976,1975,1974,1973,1972
Estas estadísticas en otros países:
AlbaniaAlgeriaAngolaArab WorldArgentinaArmeniaAustraliaAustriaAzerbaijanBahrainBangladeshBelarusBelgiumBeninBoliviaBosnia and HerzegovinaBotswanaBrazilBrunei DarussalamBulgariaCambodiaCameroonCanadaCentral Europe and the BalticsChileChinaColombiaCongo, Dem. Rep.Congo, Rep.Costa RicaCote d'IvoireCroatiaCubaCuracaoCyprusCzech RepublicDenmarkDominican RepublicEarly-demographic dividendEast Asia & PacificEast Asia & Pacific (excluding high income)East Asia & Pacific (IDA & IBRD countries)EcuadorEgypt, Arab Rep.El SalvadorEritreaEstoniaEthiopiaEuro areaEurope & Central AsiaEurope & Central Asia (excluding high income)Europe & Central Asia (IDA & IBRD countries)European UnionFinlandFragile and conflict affected situationsFranceGabonGeorgiaGermanyGhanaGibraltarGreeceGuatemalaHaitiHeavily indebted poor countries (HIPC)High incomeHondurasHong Kong SAR, ChinaHungaryIBRD onlyIcelandIDA & IBRD totalIDA blendIDA onlyIDA totalIndiaIndonesiaIran, Islamic Rep.IraqIrelandIsraelItalyJamaicaJapanJordanKazakhstanKenyaKorea, Dem. People’s Rep.Korea, Rep.KosovoKuwaitKyrgyz RepublicLate-demographic dividendLatin America & Caribbean Latin America & Caribbean (excluding high income)Latin America & the Caribbean (IDA & IBRD countries)LatviaLeast developed countries: UN classificationLebanonLibyaLithuaniaLow & middle incomeLower middle incomeLuxembourgMacedonia, FYRMalaysiaMaltaMauritiusMexicoMiddle East & North AfricaMiddle East & North Africa (excluding high income)Middle East & North Africa (IDA & IBRD countries)Middle incomeMoldovaMongoliaMontenegroMoroccoMozambiqueMyanmarNamibiaNepalNetherlandsNew ZealandNicaraguaNigerNigeriaNorth AmericaNorwayOECD membersOmanOther small statesPakistanPanamaParaguayPeruPhilippinesPolandPortugalPost-demographic dividendPre-demographic dividendQatarRomaniaRussian FederationSaudi ArabiaSenegalSerbiaSingaporeSlovak RepublicSloveniaSmall statesSouth AfricaSouth AsiaSouth Asia (IDA & IBRD)South SudanSpainSri LankaSub-Saharan Africa Sub-Saharan Africa (excluding high income)Sub-Saharan Africa (IDA & IBRD countries)SudanSwedenSwitzerlandSyrian Arab RepublicTajikistanTanzaniaThailandTogoTrinidad and TobagoTunisiaTurkeyTurkmenistanUkraineUnited Arab EmiratesUnited KingdomUnited StatesUpper middle incomeUruguayUzbekistanVenezuela, RBVietnamWorldYemen, Rep.ZambiaZimbabwe línea de tiempo (timeline):
En esta escala de tiempo se presenta un gráfico de 1972 y 2014 de Indonesia. Los datos de 1971 están ausentes. El número de observaciones reales por fecha: 43.
Fuente (nombre):
Indicadores del desarrollo mundial
Fuente (organización):
IEA Statistics © OECD/IEA 2014 (http://www.iea.org/stats/index.asp), subject to https://www.iea.org/t&c/termsandconditions/
Categorías:
Energy & Mining, Climate Change, Infrastructure
Se ha actualizado:
23 abr 2017 año
Los indicadores de los cambios de valor en los últimos años
Máximo:
51.232
1 ene 2014 año
A la fecha de observación
Valor
Cambio absoluto
El cambio con respecto al valor anterior
1 ene 1972 año
0.0
0.0
0.0%
1 ene 1986 año
2.405
+2.405
%
1 ene 1987 año
24.027
+21.623
899.22%
1 ene 1988 año
27.582
+3.555
14.8%
1 ene 1989 año
27.209
-0.373
-1.35%
1 ene 1990 año
29.77
+2.561
9.41%
1 ene 1991 año
29.902
+0.132
0.44%
1 ene 1992 año
29.582
-0.32
-1.07%
1 ene 1993 año
27.37
-2.212
-7.48%
1 ene 1994 año
23.526
-3.843
-14.04%
1 ene 1995 año
24.933
+1.406
5.98%
1 ene 1996 año
24.271
-0.661
-2.65%
1 ene 1997 año
25.158
+0.887
3.65%
1 ene 1998 año
27.893
+2.735
10.87%
1 ene 1999 año
30.972
+3.079
11.04%
1 ene 2000 año
34.179
+3.207
10.35%
1 ene 2001 año
36.434
+2.255
6.6%
1 ene 2002 año
37.246
+0.812
2.23%
1 ene 2003 año
39.669
+2.423
6.51%
1 ene 2004 año
41.124
+1.454
3.67%
1 ene 2005 año
40.121
-1.002
-2.44%
1 ene 2006 año
40.613
+0.492
1.23%
1 ene 2007 año
44.059
+3.446
8.48%
1 ene 2008 año
44.894
+0.835
1.9%
1 ene 2009 año
41.113
-3.781
-8.42%
1 ene 2010 año
42.029
+0.916
2.23%
1 ene 2011 año
40.32
-1.708
-4.06%
1 ene 2012 año
44.188
+3.868
9.59%
1 ene 2013 año
49.361
+5.173
11.71%
1 ene 2014 año
51.232
+1.871
3.79%
Ranking de los países por los datos estadísticos actuales


Comentarios: