29
/es/
es
AIzaSyAYiBZKx7MnpbEhh9jyipgxe19OcubqV5w
April 1, 2024
238944
Sierra Leone
SLE
true
2
1
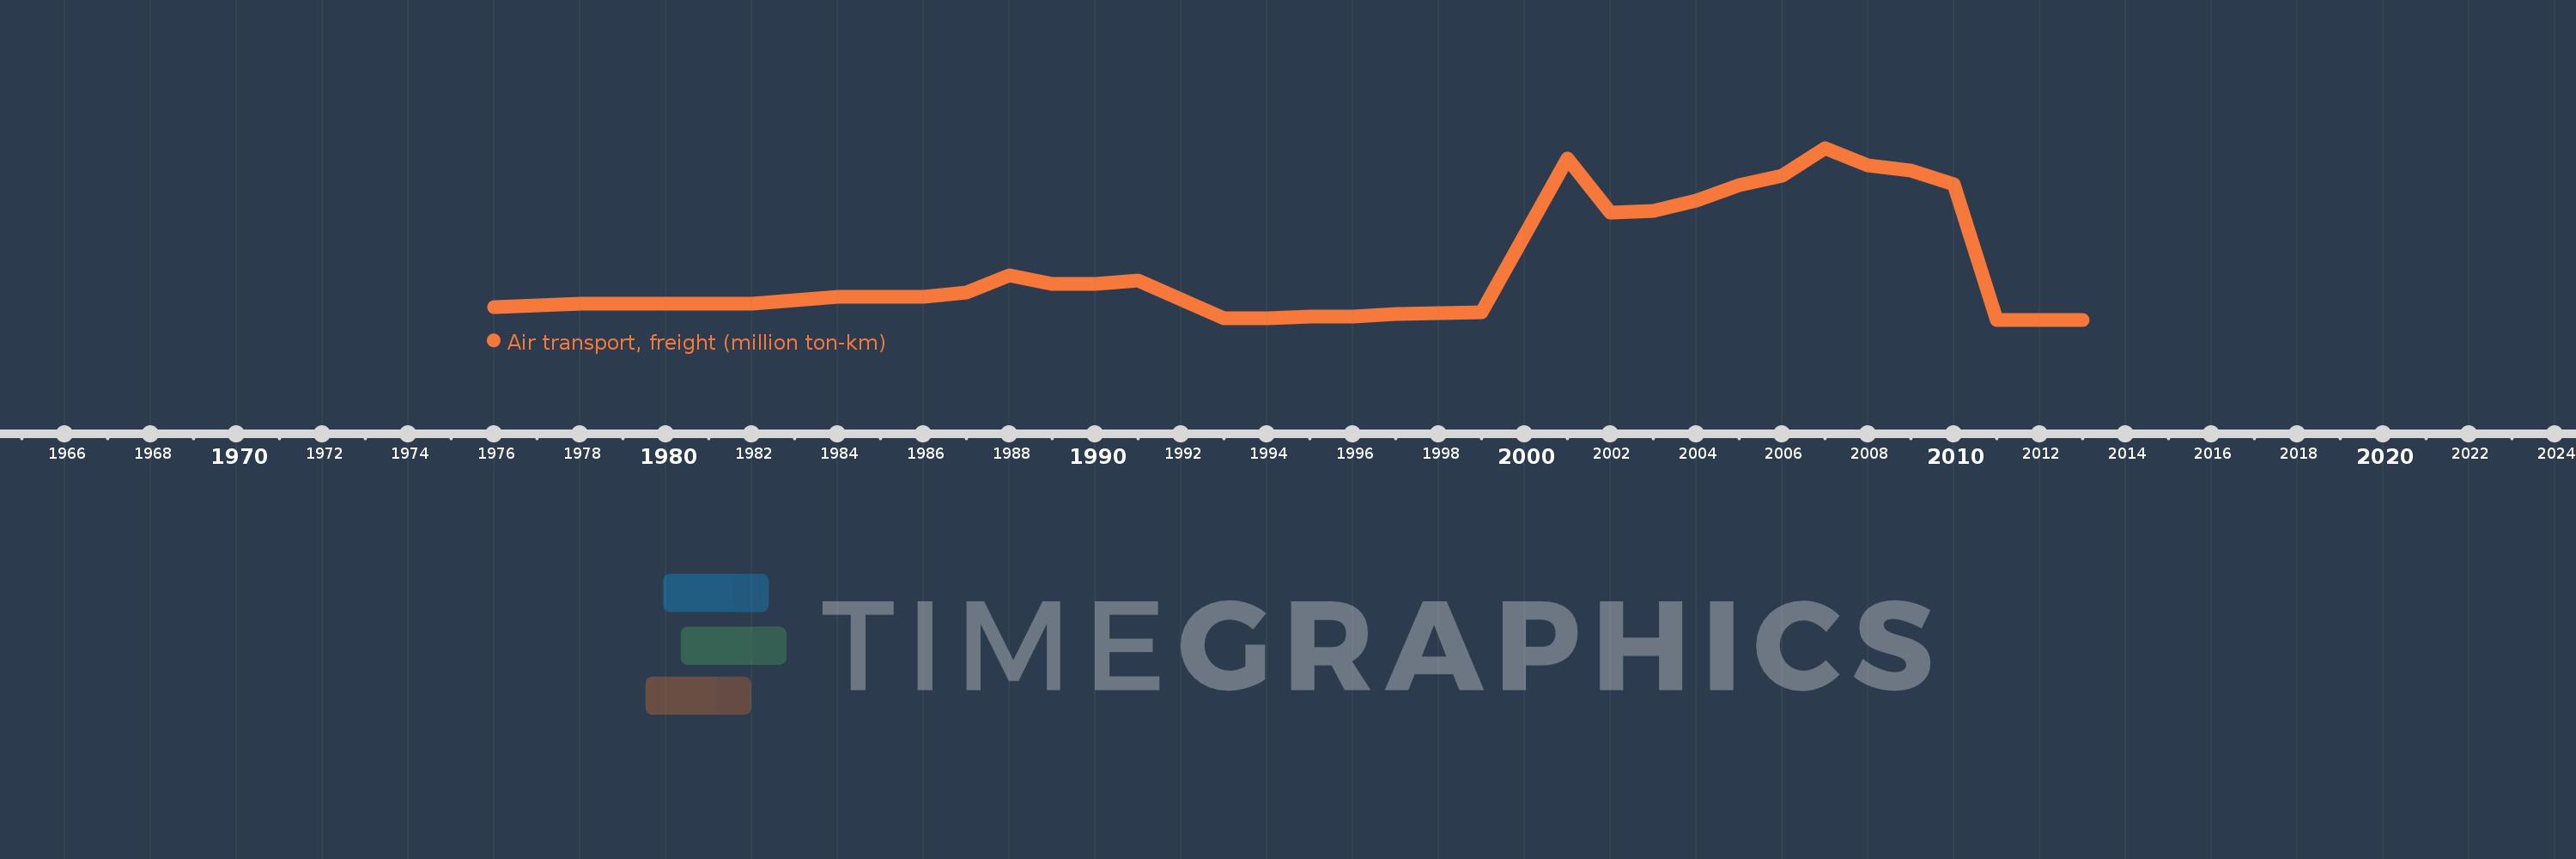
Air transport, freight (million ton-km)
2013,2012,2011,2010,2009,2008,2007,2006,2005,2004,2003,2002,2001,1999,1997,1996,1995,1994,1993,1991,1990,1989,1988,1987,1986,1985,1984,1983,1982,1981,1980,1979,1978,1977,1976
Estas estadísticas en otros países:
AfghanistanAlbaniaAlgeriaAmerican SamoaAngolaAntigua and BarbudaArab WorldArgentinaArmeniaAustraliaAustriaAzerbaijanBahamas, TheBahrainBangladeshBarbadosBelarusBelgiumBelizeBeninBhutanBoliviaBosnia and HerzegovinaBotswanaBrazilBrunei DarussalamBulgariaBurkina FasoBurundiCabo VerdeCambodiaCameroonCanadaCaribbean small statesCentral African RepublicCentral Europe and the BalticsChadChileChinaColombiaComorosCongo, Dem. Rep.Congo, Rep.Costa RicaCote d'IvoireCroatiaCubaCyprusCzech RepublicDenmarkDjiboutiDominican RepublicEarly-demographic dividendEast Asia & PacificEast Asia & Pacific (excluding high income)East Asia & Pacific (IDA & IBRD countries)EcuadorEgypt, Arab Rep.El SalvadorEquatorial GuineaEritreaEstoniaEthiopiaEuro areaEurope & Central AsiaEurope & Central Asia (excluding high income)Europe & Central Asia (IDA & IBRD countries)European UnionFijiFinlandFragile and conflict affected situationsFranceGabonGambia, TheGeorgiaGermanyGhanaGreeceGuamGuatemalaGuineaGuinea-BissauGuyanaHaitiHeavily indebted poor countries (HIPC)High incomeHondurasHong Kong SAR, ChinaHungaryIBRD onlyIcelandIDA & IBRD totalIDA blendIDA onlyIDA totalIndiaIndonesiaIran, Islamic Rep.IraqIrelandIsraelItalyJamaicaJapanJordanKazakhstanKenyaKiribatiKorea, Dem. People’s Rep.Korea, Rep.KuwaitKyrgyz RepublicLao PDRLate-demographic dividendLatin America & Caribbean Latin America & Caribbean (excluding high income)Latin America & the Caribbean (IDA & IBRD countries)LatviaLeast developed countries: UN classificationLebanonLesothoLiberiaLibyaLithuaniaLow & middle incomeLow incomeLower middle incomeLuxembourgMacao SAR, ChinaMacedonia, FYRMadagascarMalawiMalaysiaMaldivesMaliMaltaMarshall IslandsMauritaniaMauritiusMexicoMiddle East & North AfricaMiddle East & North Africa (excluding high income)Middle East & North Africa (IDA & IBRD countries)Middle incomeMoldovaMonacoMongoliaMontenegroMoroccoMozambiqueMyanmarNamibiaNauruNepalNetherlandsNew ZealandNicaraguaNigerNigeriaNorth AmericaNorwayOECD membersOmanOther small statesPacific island small statesPakistanPanamaPapua New GuineaParaguayPeruPhilippinesPolandPortugalPost-demographic dividendPre-demographic dividendQatarRomaniaRussian FederationRwandaSamoaSao Tome and PrincipeSaudi ArabiaSenegalSerbiaSeychellesSierra LeoneSingaporeSlovak RepublicSloveniaSmall statesSolomon IslandsSomaliaSouth AfricaSouth AsiaSouth Asia (IDA & IBRD)SpainSri LankaSub-Saharan Africa Sub-Saharan Africa (excluding high income)Sub-Saharan Africa (IDA & IBRD countries)SudanSurinameSwazilandSwedenSwitzerlandSyrian Arab RepublicTajikistanTanzaniaThailandTogoTongaTrinidad and TobagoTunisiaTurkeyTurkmenistanUgandaUkraineUnited Arab EmiratesUnited KingdomUnited StatesUpper middle incomeUruguayUzbekistanVanuatuVenezuela, RBVietnamWorldYemen, Rep.ZambiaZimbabwe línea de tiempo (timeline):
En esta escala de tiempo se presenta un gráfico de 1976 y 2013 de Sierra Leone. Los datos de 1975 están ausentes. El número de observaciones reales por fecha: 35.
Fuente (nombre):
Indicadores del desarrollo mundial
Fuente (organización):
International Civil Aviation Organization, Civil Aviation Statistics of the World and ICAO staff estimates.
Categorías:
Infrastructure
Se ha actualizado:
23 abr 2017 año
Los indicadores de los cambios de valor en los últimos años
Máximo:
9.591
1 ene 2007 año
A la fecha de observación
Valor
Cambio absoluto
El cambio con respecto al valor anterior
1 ene 1976 año
0.7
+0.7
0.0%
1 ene 1977 año
0.8
+0.1
14.29%
1 ene 1978 año
0.9
+0.1
12.5%
1 ene 1979 año
0.9
0.0
0.0%
1 ene 1980 año
0.9
0.0
0.0%
1 ene 1981 año
0.9
0.0
0.0%
1 ene 1982 año
0.9
0.0
0.0%
1 ene 1983 año
1.1
+0.2
22.22%
1 ene 1984 año
1.3
+0.2
18.18%
1 ene 1985 año
1.3
0.0
0.0%
1 ene 1986 año
1.3
0.0
0.0%
1 ene 1987 año
1.5
+0.2
15.38%
1 ene 1988 año
2.5
+1.0
66.67%
1 ene 1989 año
2.0
-0.5
-20.0%
1 ene 1990 año
2.0
0.0
0.0%
1 ene 1991 año
2.2
+0.2
10.0%
1 ene 1993 año
0.1
-2.1
-95.45%
1 ene 1994 año
0.1
0.0
0.0%
1 ene 1995 año
0.2
+0.1
100.0%
1 ene 1996 año
0.2
0.0
0.0%
1 ene 1997 año
0.3
+0.1
50.0%
1 ene 1999 año
0.4
+0.1
33.33%
1 ene 2001 año
9.0
+8.6
2.15 mil%
1 ene 2002 año
6.0
-3.0
-33.33%
1 ene 2003 año
6.06
+0.06
1.0%
1 ene 2004 año
6.666
+0.606
10.0%
1 ene 2005 año
7.533
+0.867
13.01%
1 ene 2006 año
8.06
+0.527
7.0%
1 ene 2007 año
9.591
+1.531
19.0%
1 ene 2008 año
8.632
-0.959
-10.0%
1 ene 2009 año
8.34
-0.292
-3.38%
1 ene 2010 año
7.581
-0.759
-9.1%
1 ene 2011 año
0.0
-7.581
-100.0%
Ranking de los países por los datos estadísticos actuales


Comentarios: