29
/es/
es
AIzaSyAYiBZKx7MnpbEhh9jyipgxe19OcubqV5w
April 1, 2024
156974
Iran, Islamic Rep.
IRN
true
2
1
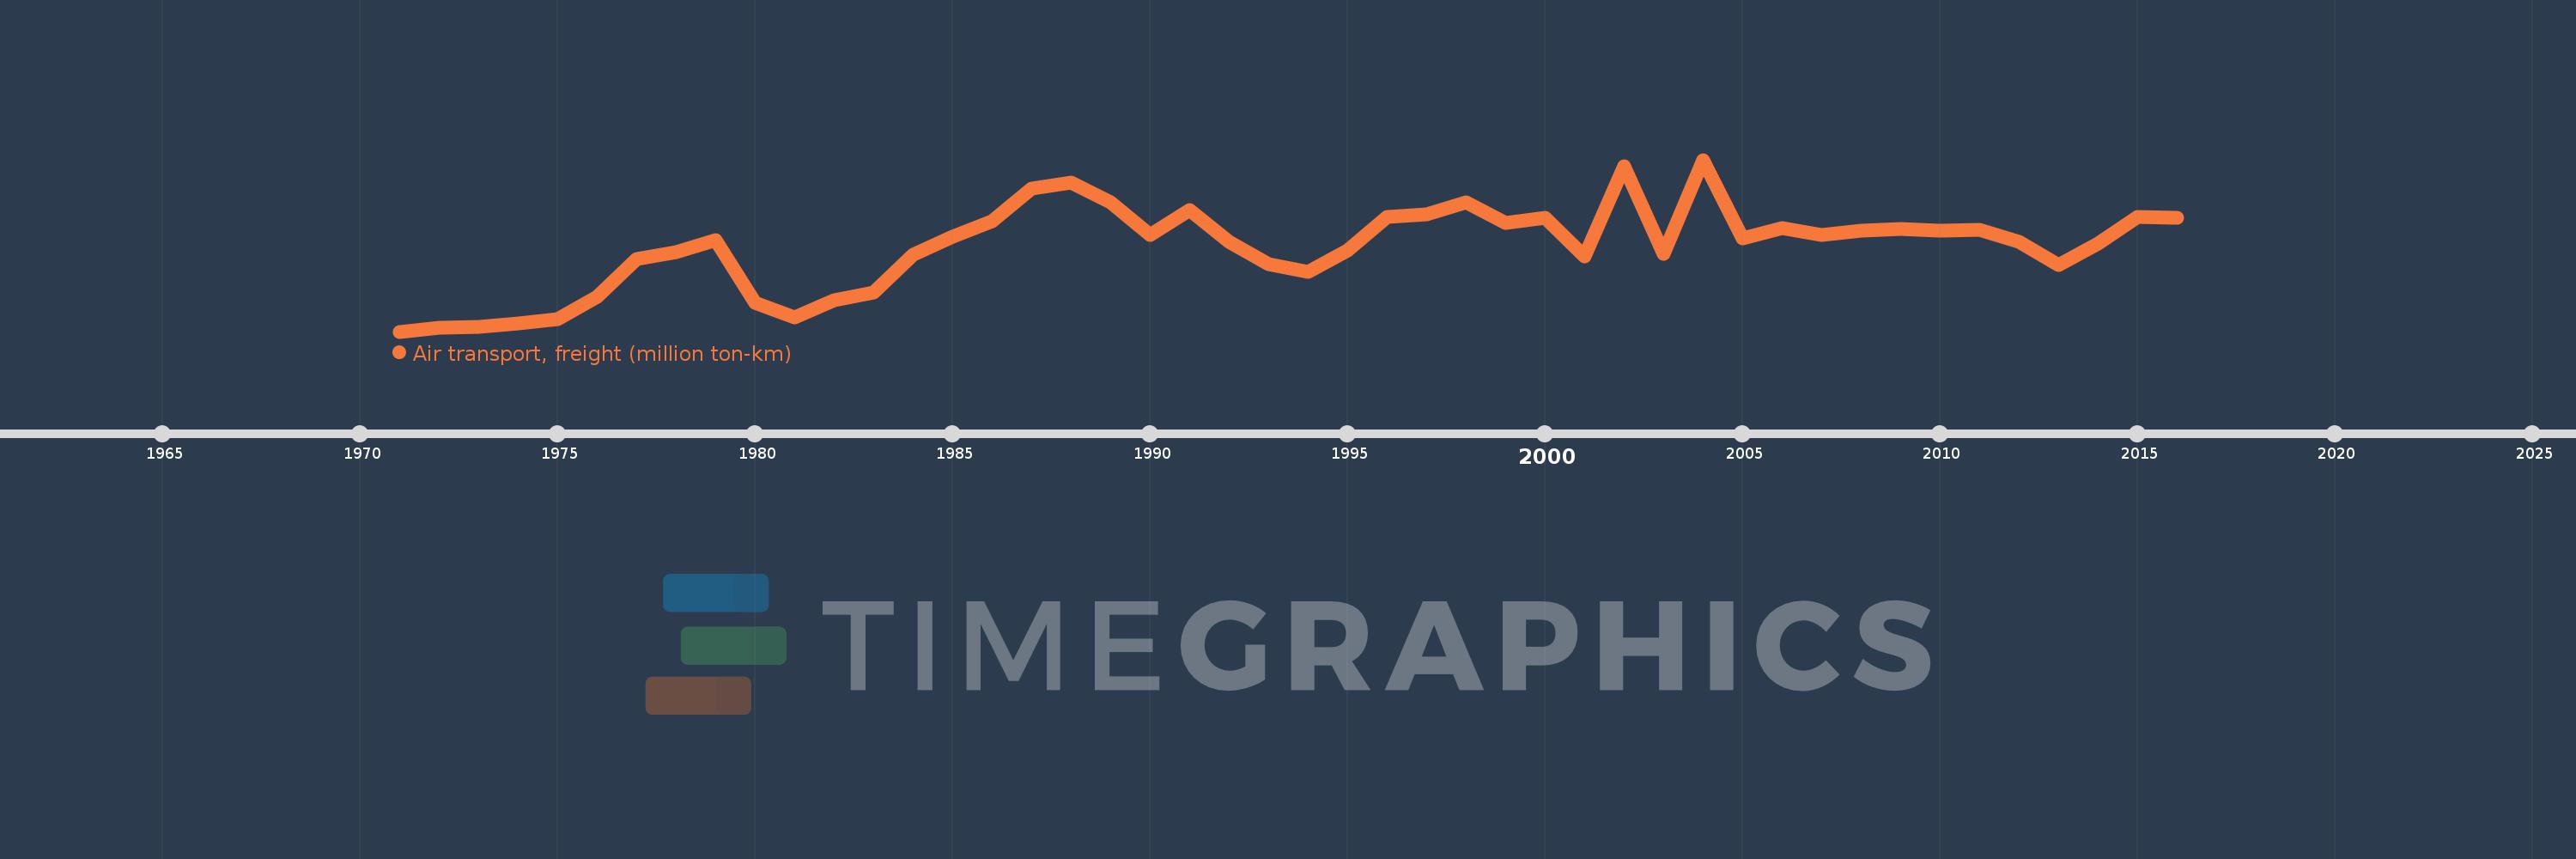
Air transport, freight (million ton-km)
2016,2015,2014,2013,2012,2011,2010,2009,2008,2007,2006,2005,2004,2003,2002,2001,2000,1999,1998,1997,1996,1995,1994,1993,1992,1991,1990,1989,1988,1987,1986,1985,1984,1983,1982,1981,1980,1979,1978,1977,1976,1975,1974,1973,1972,1971
Estas estadísticas en otros países:
AfghanistanAlbaniaAlgeriaAmerican SamoaAngolaAntigua and BarbudaArab WorldArgentinaArmeniaAustraliaAustriaAzerbaijanBahamas, TheBahrainBangladeshBarbadosBelarusBelgiumBelizeBeninBhutanBoliviaBosnia and HerzegovinaBotswanaBrazilBrunei DarussalamBulgariaBurkina FasoBurundiCabo VerdeCambodiaCameroonCanadaCaribbean small statesCentral African RepublicCentral Europe and the BalticsChadChileChinaColombiaComorosCongo, Dem. Rep.Congo, Rep.Costa RicaCote d'IvoireCroatiaCubaCyprusCzech RepublicDenmarkDjiboutiDominican RepublicEarly-demographic dividendEast Asia & PacificEast Asia & Pacific (excluding high income)East Asia & Pacific (IDA & IBRD countries)EcuadorEgypt, Arab Rep.El SalvadorEquatorial GuineaEritreaEstoniaEthiopiaEuro areaEurope & Central AsiaEurope & Central Asia (excluding high income)Europe & Central Asia (IDA & IBRD countries)European UnionFijiFinlandFragile and conflict affected situationsFranceGabonGambia, TheGeorgiaGermanyGhanaGreeceGuamGuatemalaGuineaGuinea-BissauGuyanaHaitiHeavily indebted poor countries (HIPC)High incomeHondurasHong Kong SAR, ChinaHungaryIBRD onlyIcelandIDA & IBRD totalIDA blendIDA onlyIDA totalIndiaIndonesiaIran, Islamic Rep.IraqIrelandIsraelItalyJamaicaJapanJordanKazakhstanKenyaKiribatiKorea, Dem. People’s Rep.Korea, Rep.KuwaitKyrgyz RepublicLao PDRLate-demographic dividendLatin America & Caribbean Latin America & Caribbean (excluding high income)Latin America & the Caribbean (IDA & IBRD countries)LatviaLeast developed countries: UN classificationLebanonLesothoLiberiaLibyaLithuaniaLow & middle incomeLow incomeLower middle incomeLuxembourgMacao SAR, ChinaMacedonia, FYRMadagascarMalawiMalaysiaMaldivesMaliMaltaMarshall IslandsMauritaniaMauritiusMexicoMiddle East & North AfricaMiddle East & North Africa (excluding high income)Middle East & North Africa (IDA & IBRD countries)Middle incomeMoldovaMonacoMongoliaMontenegroMoroccoMozambiqueMyanmarNamibiaNauruNepalNetherlandsNew ZealandNicaraguaNigerNigeriaNorth AmericaNorwayOECD membersOmanOther small statesPacific island small statesPakistanPanamaPapua New GuineaParaguayPeruPhilippinesPolandPortugalPost-demographic dividendPre-demographic dividendQatarRomaniaRussian FederationRwandaSamoaSao Tome and PrincipeSaudi ArabiaSenegalSerbiaSeychellesSierra LeoneSingaporeSlovak RepublicSloveniaSmall statesSolomon IslandsSomaliaSouth AfricaSouth AsiaSouth Asia (IDA & IBRD)SpainSri LankaSub-Saharan Africa Sub-Saharan Africa (excluding high income)Sub-Saharan Africa (IDA & IBRD countries)SudanSurinameSwazilandSwedenSwitzerlandSyrian Arab RepublicTajikistanTanzaniaThailandTogoTongaTrinidad and TobagoTunisiaTurkeyTurkmenistanUgandaUkraineUnited Arab EmiratesUnited KingdomUnited StatesUpper middle incomeUruguayUzbekistanVanuatuVenezuela, RBVietnamWorldYemen, Rep.ZambiaZimbabwe línea de tiempo (timeline):
En esta escala de tiempo se presenta un gráfico de 1971 y 2016 de Iran, Islamic Rep.. Los datos de 1970 están ausentes. El número de observaciones reales por fecha: 46.
Fuente (nombre):
Indicadores del desarrollo mundial
Fuente (organización):
International Civil Aviation Organization, Civil Aviation Statistics of the World and ICAO staff estimates.
Categorías:
Infrastructure
Se ha actualizado:
23 abr 2017 año
Los indicadores de los cambios de valor en los últimos años
Máximo:
157.374
1 ene 2004 año
A la fecha de observación
Valor
Cambio absoluto
El cambio con respecto al valor anterior
1 ene 1971 año
8.0
+8.0
0.0%
1 ene 1972 año
11.1
+3.1
38.75%
1 ene 1973 año
11.9
+0.8
7.21%
1 ene 1974 año
15.0
+3.1
26.05%
1 ene 1975 año
18.8
+3.8
25.33%
1 ene 1976 año
38.5
+19.7
104.79%
1 ene 1977 año
70.8
+32.3
83.9%
1 ene 1978 año
77.2
+6.4
9.04%
1 ene 1979 año
87.3
+10.1
13.08%
1 ene 1980 año
33.3
-54.0
-61.86%
1 ene 1981 año
20.3
-13.0
-39.04%
1 ene 1982 año
35.6
+15.3
75.37%
1 ene 1983 año
42.1
+6.5
18.26%
1 ene 1984 año
74.7
+32.6
77.43%
1 ene 1985 año
90.3
+15.6
20.88%
1 ene 1986 año
104.3
+14.0
15.5%
1 ene 1987 año
132.0
+27.7
26.56%
1 ene 1988 año
137.8
+5.8
4.39%
1 ene 1989 año
120.6
-17.2
-12.48%
1 ene 1990 año
92.3
-28.3
-23.47%
1 ene 1991 año
113.7
+21.4
23.19%
1 ene 1992 año
86.1
-27.6
-24.27%
1 ene 1993 año
66.5
-19.6
-22.76%
1 ene 1994 año
60.0
-6.5
-9.77%
1 ene 1995 año
78.8
+18.8
31.33%
1 ene 1996 año
107.9
+29.1
36.93%
1 ene 1997 año
109.6
+1.7
1.58%
1 ene 1998 año
120.2
+10.6
9.67%
1 ene 1999 año
102.3
-17.9
-14.89%
1 ene 2000 año
107.1
+4.8
4.69%
1 ene 2001 año
73.719
-33.381
-31.17%
1 ene 2002 año
152.139
+78.42
106.38%
1 ene 2003 año
75.457
-76.682
-50.4%
1 ene 2004 año
157.374
+81.917
108.56%
1 ene 2005 año
89.034
-68.34
-43.43%
1 ene 2006 año
98.218
+9.184
10.32%
1 ene 2007 año
91.86
-6.358
-6.47%
1 ene 2008 año
95.425
+3.565
3.88%
1 ene 2009 año
97.324
+1.899
1.99%
1 ene 2010 año
95.769
-1.555
-1.6%
1 ene 2011 año
96.538
+0.769
0.8%
1 ene 2012 año
85.876
-10.662
-11.04%
1 ene 2013 año
66.234
-19.642
-22.87%
1 ene 2014 año
84.459
+18.225
27.52%
1 ene 2015 año
107.955
+23.496
27.82%
1 ene 2016 año
107.185
-0.77
-0.71%
Ranking de los países por los datos estadísticos actuales


Comentarios: