29
/es/
es
AIzaSyAYiBZKx7MnpbEhh9jyipgxe19OcubqV5w
April 1, 2024
238717
Seychelles
SYC
true
2
1
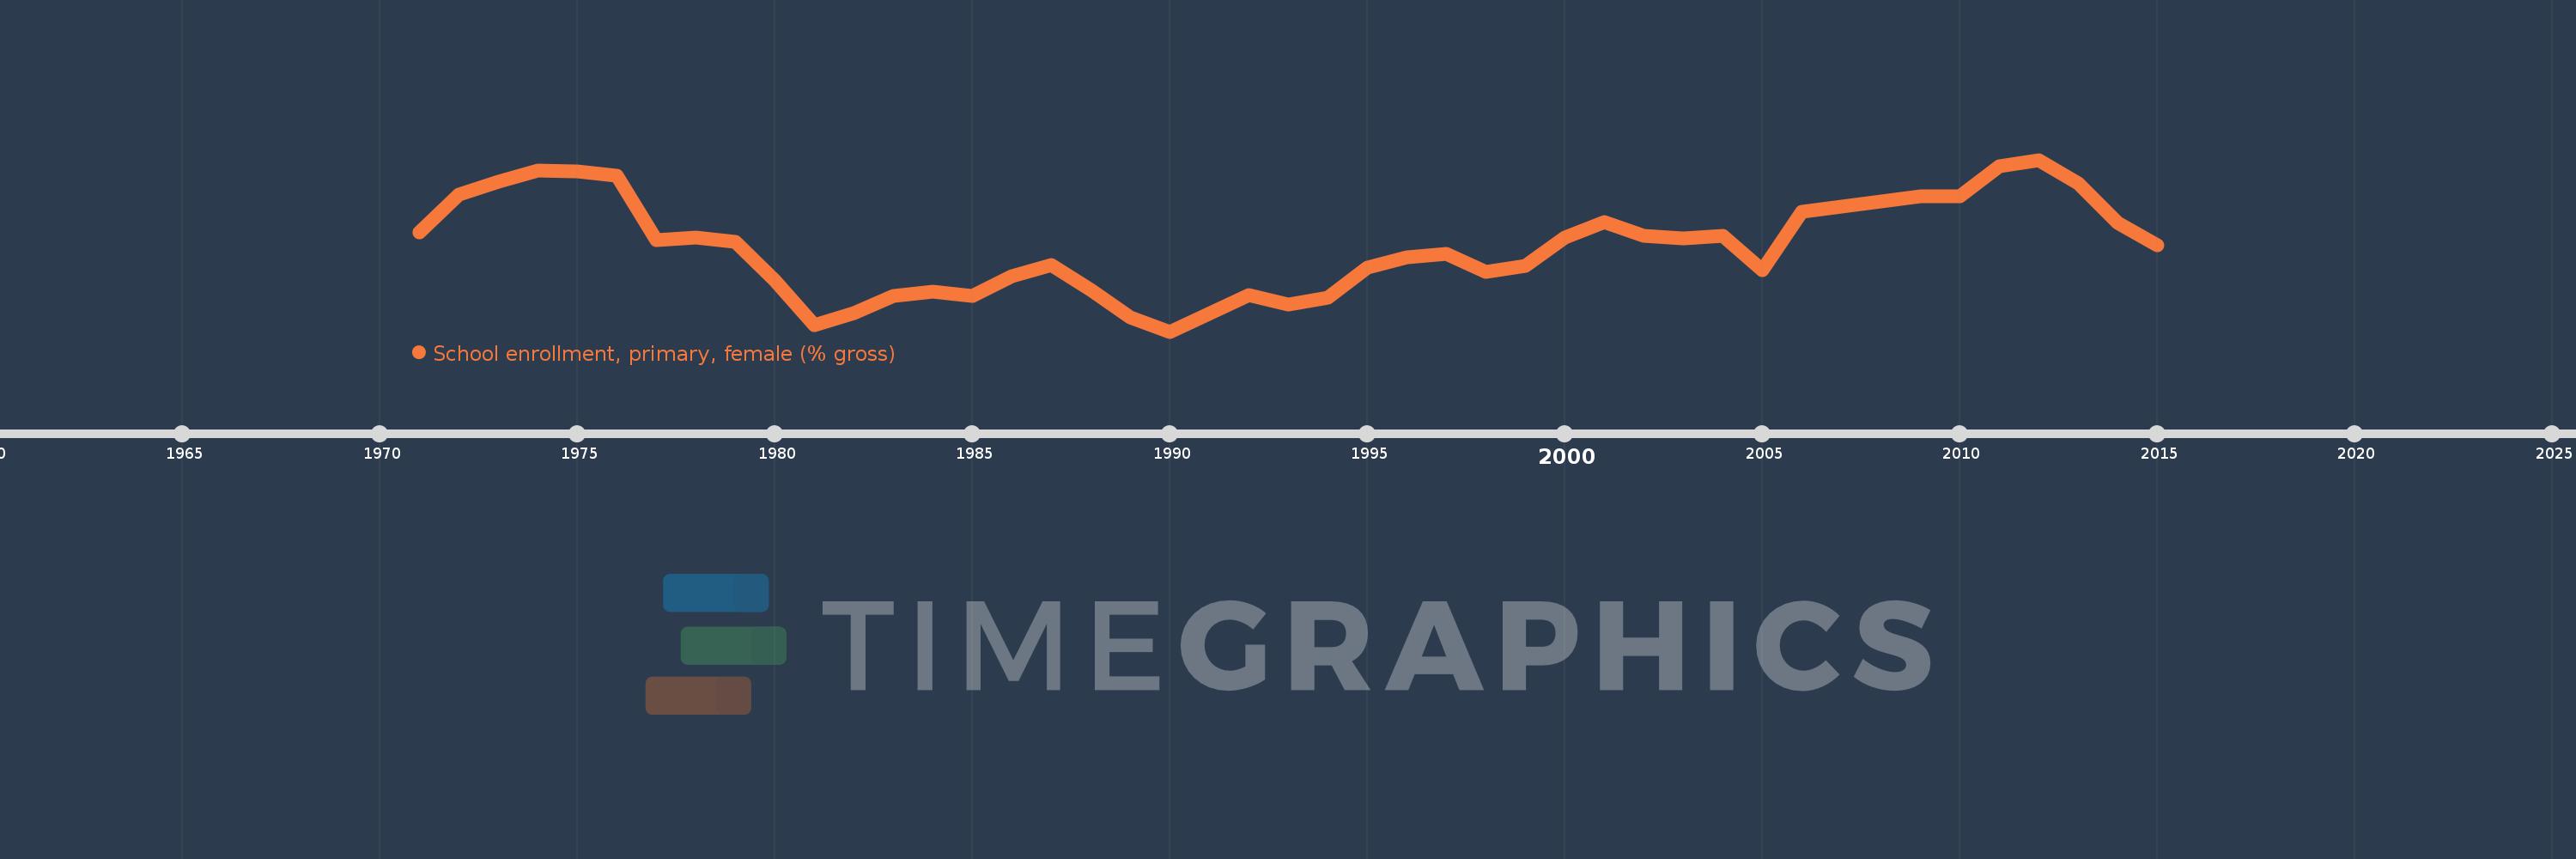
School enrollment, primary, female (% gross)
2015,2014,2013,2012,2011,2010,2009,2008,2006,2005,2004,2003,2002,2001,2000,1999,1998,1997,1996,1995,1994,1993,1992,1990,1989,1988,1987,1986,1985,1984,1983,1982,1981,1980,1979,1978,1977,1976,1975,1974,1973,1972,1971
Estas estadísticas en otros países:
AfghanistanAlbaniaAlgeriaAndorraAngolaAntigua and BarbudaArab WorldArgentinaArmeniaArubaAustraliaAustriaAzerbaijanBahamas, TheBahrainBangladeshBarbadosBelarusBelgiumBelizeBeninBermudaBhutanBoliviaBosnia and HerzegovinaBotswanaBrazilBrunei DarussalamBulgariaBurkina FasoBurundiCabo VerdeCambodiaCameroonCanadaCaribbean small statesCentral African RepublicCentral Europe and the BalticsChadChileChinaColombiaComorosCongo, Dem. Rep.Congo, Rep.Costa RicaCote d'IvoireCroatiaCubaCuracaoCyprusCzech RepublicDenmarkDjiboutiDominicaDominican RepublicEarly-demographic dividendEast Asia & PacificEast Asia & Pacific (excluding high income)East Asia & Pacific (IDA & IBRD countries)EcuadorEgypt, Arab Rep.El SalvadorEquatorial GuineaEritreaEstoniaEthiopiaEuro areaEurope & Central AsiaEurope & Central Asia (excluding high income)Europe & Central Asia (IDA & IBRD countries)European UnionFijiFinlandFragile and conflict affected situationsFranceGabonGambia, TheGeorgiaGermanyGhanaGreeceGrenadaGuatemalaGuineaGuinea-BissauGuyanaHaitiHeavily indebted poor countries (HIPC)High incomeHondurasHong Kong SAR, ChinaHungaryIBRD onlyIcelandIDA & IBRD totalIDA blendIDA onlyIDA totalIndiaIndonesiaIran, Islamic Rep.IraqIrelandIsraelItalyJamaicaJapanJordanKazakhstanKenyaKiribatiKorea, Dem. People’s Rep.Korea, Rep.KuwaitKyrgyz RepublicLao PDRLate-demographic dividendLatin America & Caribbean Latin America & Caribbean (excluding high income)Latin America & the Caribbean (IDA & IBRD countries)LatviaLeast developed countries: UN classificationLebanonLesothoLiberiaLibyaLiechtensteinLithuaniaLow & middle incomeLow incomeLower middle incomeLuxembourgMacao SAR, ChinaMacedonia, FYRMadagascarMalawiMaldivesMaliMaltaMarshall IslandsMauritaniaMauritiusMexicoMicronesia, Fed. Sts.Middle East & North AfricaMiddle East & North Africa (excluding high income)Middle East & North Africa (IDA & IBRD countries)Middle incomeMoldovaMongoliaMontenegroMoroccoMozambiqueMyanmarNamibiaNauruNepalNetherlandsNew ZealandNicaraguaNigerNigeriaNorth AmericaNorwayOECD membersOmanOther small statesPacific island small statesPakistanPalauPanamaPapua New GuineaParaguayPeruPhilippinesPolandPortugalPost-demographic dividendPre-demographic dividendPuerto RicoQatarRomaniaRussian FederationRwandaSamoaSan MarinoSao Tome and PrincipeSaudi ArabiaSenegalSerbiaSeychellesSierra LeoneSlovak RepublicSloveniaSmall statesSolomon IslandsSomaliaSouth AfricaSouth AsiaSouth Asia (IDA & IBRD)South SudanSpainSri LankaSt. Kitts and NevisSt. LuciaSt. Vincent and the GrenadinesSub-Saharan Africa Sub-Saharan Africa (excluding high income)Sub-Saharan Africa (IDA & IBRD countries)SudanSurinameSwazilandSwedenSwitzerlandSyrian Arab RepublicTajikistanTanzaniaThailandTimor-LesteTogoTongaTrinidad and TobagoTunisiaTurkeyTurkmenistanTuvaluUgandaUkraineUnited Arab EmiratesUnited KingdomUnited StatesUpper middle incomeUruguayUzbekistanVanuatuVenezuela, RBVietnamWest Bank and GazaWorldYemen, Rep.ZambiaZimbabwe línea de tiempo (timeline):
En esta escala de tiempo se presenta un gráfico de 1971 y 2015 de Seychelles. Los datos de 1970 están ausentes. El número de observaciones reales por fecha: 43.
Fuente (nombre):
Indicadores del desarrollo mundial
Fuente (organización):
United Nations Educational, Scientific, and Cultural Organization (UNESCO) Institute for Statistics.
Categorías:
Education, Gender
Se ha actualizado:
23 abr 2017 año
Los indicadores de los cambios de valor en los últimos años
Mínimo:
96.195
1 ene 1990 año
Máximo:
113.191
1 ene 2012 año
A la fecha de observación
Valor
Cambio absoluto
El cambio con respecto al valor anterior
1 ene 1971 año
106.024
+106.024
0.0%
1 ene 1972 año
109.724
+3.701
3.49%
1 ene 1973 año
110.984
+1.26
1.15%
1 ene 1974 año
112.166
+1.182
1.06%
1 ene 1975 año
112.083
-0.084
-0.07%
1 ene 1976 año
111.634
-0.449
-0.4%
1 ene 1977 año
105.268
-6.366
-5.7%
1 ene 1978 año
105.489
+0.222
0.21%
1 ene 1979 año
105.039
-0.45
-0.43%
1 ene 1980 año
101.229
-3.81
-3.63%
1 ene 1981 año
96.795
-4.433
-4.38%
1 ene 1982 año
98.05
+1.254
1.3%
1 ene 1983 año
99.711
+1.661
1.69%
1 ene 1984 año
100.145
+0.434
0.44%
1 ene 1985 año
99.686
-0.46
-0.46%
1 ene 1986 año
101.675
+1.989
2.0%
1 ene 1987 año
102.777
+1.102
1.08%
1 ene 1988 año
100.332
-2.445
-2.38%
1 ene 1989 año
97.594
-2.738
-2.73%
1 ene 1990 año
96.195
-1.398
-1.43%
1 ene 1992 año
99.779
+3.584
3.73%
1 ene 1993 año
98.835
-0.944
-0.95%
1 ene 1994 año
99.543
+0.708
0.72%
1 ene 1995 año
102.545
+3.001
3.01%
1 ene 1996 año
103.57
+1.025
1.0%
1 ene 1997 año
103.889
+0.32
0.31%
1 ene 1998 año
102.09
-1.799
-1.73%
1 ene 1999 año
102.679
+0.589
0.58%
1 ene 2000 año
105.515
+2.836
2.76%
1 ene 2001 año
107.036
+1.521
1.44%
1 ene 2002 año
105.641
-1.395
-1.3%
1 ene 2003 año
105.453
-0.188
-0.18%
1 ene 2004 año
105.685
+0.232
0.22%
1 ene 2005 año
102.308
-3.378
-3.2%
1 ene 2006 año
108.01
+5.702
5.57%
1 ene 2008 año
109.039
+1.029
0.95%
1 ene 2009 año
109.597
+0.559
0.51%
1 ene 2010 año
109.579
-0.019
-0.02%
1 ene 2011 año
112.523
+2.944
2.69%
1 ene 2012 año
113.191
+0.669
0.59%
1 ene 2013 año
110.816
-2.376
-2.1%
1 ene 2014 año
106.931
-3.885
-3.51%
1 ene 2015 año
104.703
-2.228
-2.08%
Ranking de los países por los datos estadísticos actuales


Comentarios: