29
/es/
es
AIzaSyAYiBZKx7MnpbEhh9jyipgxe19OcubqV5w
April 1, 2024
156698
Indonesia
IDN
true
2
1
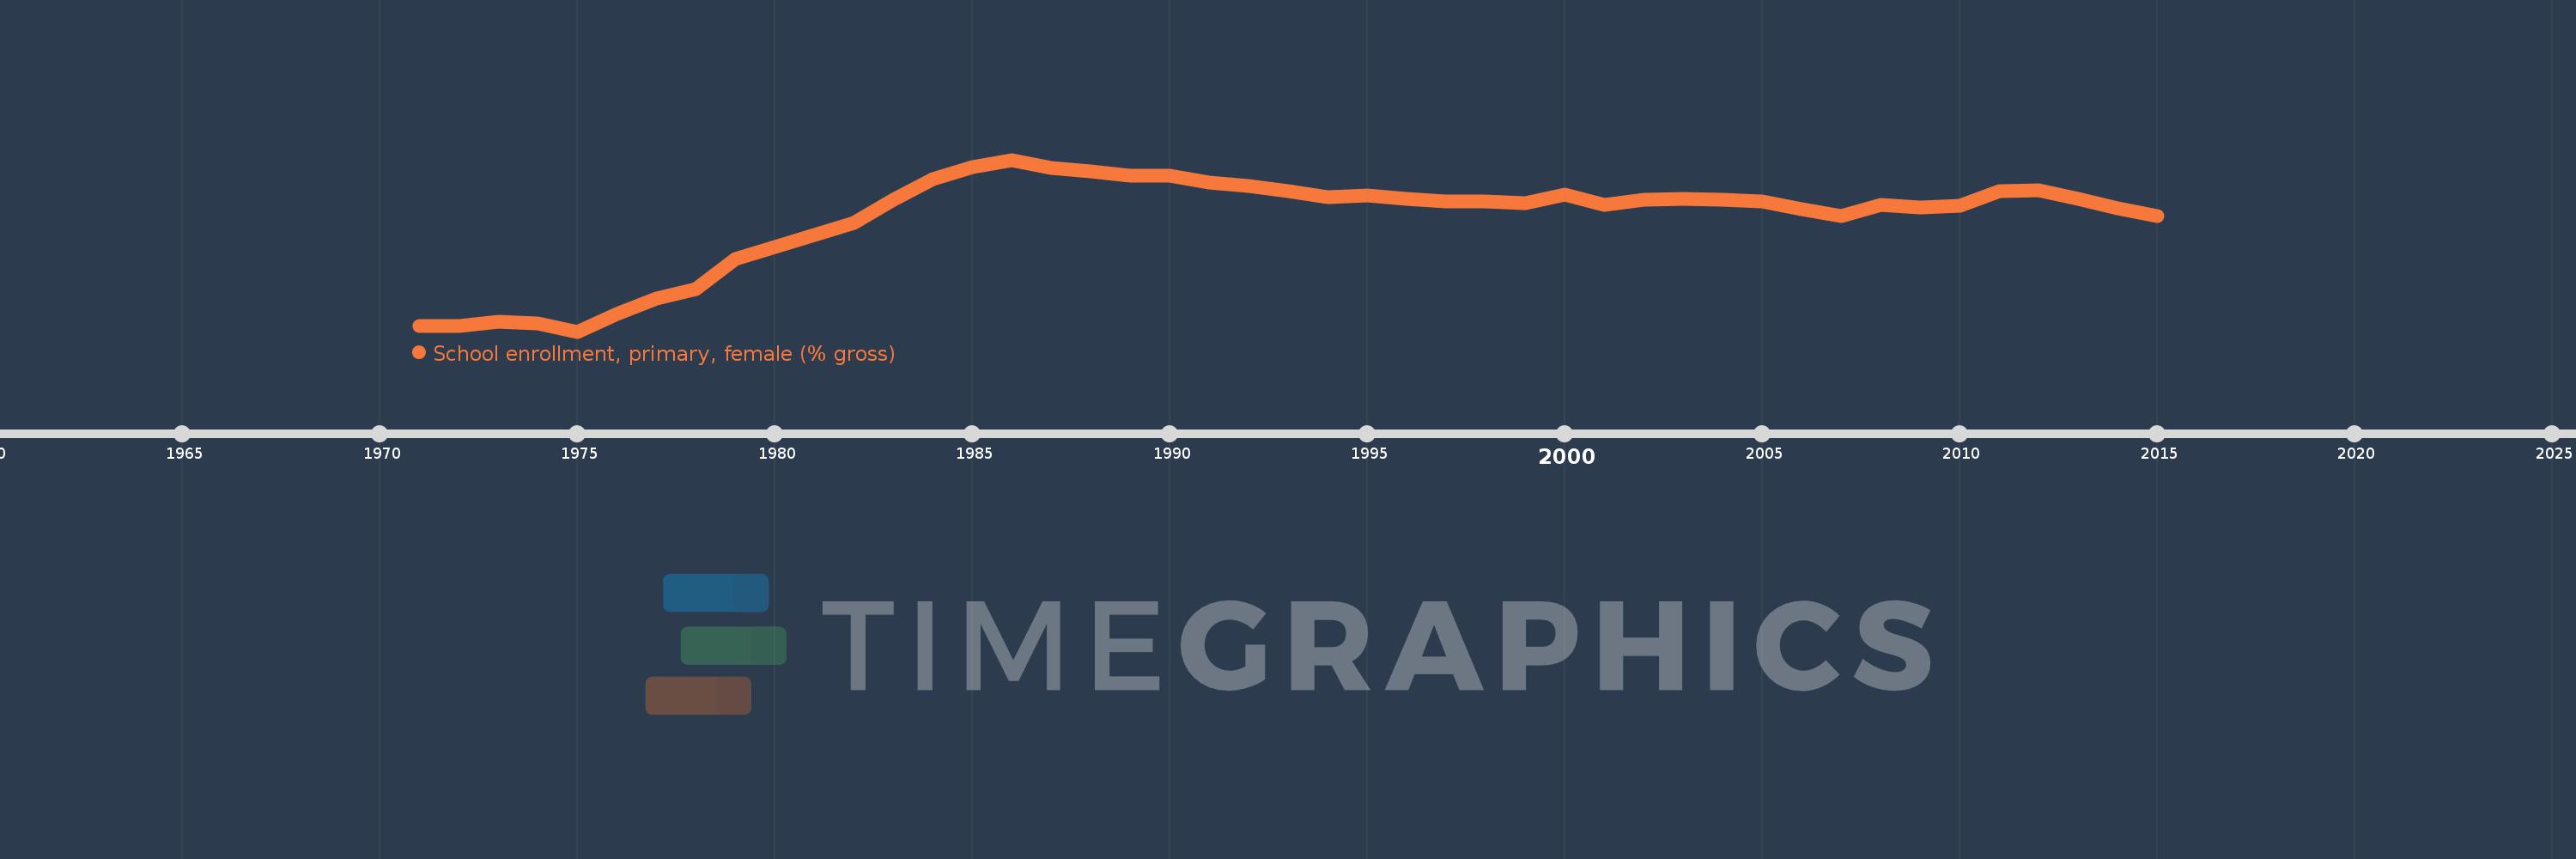
School enrollment, primary, female (% gross)
2015,2014,2013,2012,2011,2010,2009,2008,2007,2006,2005,2004,2003,2002,2001,2000,1999,1998,1997,1996,1995,1994,1993,1992,1991,1990,1989,1988,1987,1986,1985,1984,1983,1982,1979,1978,1977,1976,1975,1974,1973,1972,1971
Estas estadísticas en otros países:
AfghanistanAlbaniaAlgeriaAndorraAngolaAntigua and BarbudaArab WorldArgentinaArmeniaArubaAustraliaAustriaAzerbaijanBahamas, TheBahrainBangladeshBarbadosBelarusBelgiumBelizeBeninBermudaBhutanBoliviaBosnia and HerzegovinaBotswanaBrazilBrunei DarussalamBulgariaBurkina FasoBurundiCabo VerdeCambodiaCameroonCanadaCaribbean small statesCentral African RepublicCentral Europe and the BalticsChadChileChinaColombiaComorosCongo, Dem. Rep.Congo, Rep.Costa RicaCote d'IvoireCroatiaCubaCuracaoCyprusCzech RepublicDenmarkDjiboutiDominicaDominican RepublicEarly-demographic dividendEast Asia & PacificEast Asia & Pacific (excluding high income)East Asia & Pacific (IDA & IBRD countries)EcuadorEgypt, Arab Rep.El SalvadorEquatorial GuineaEritreaEstoniaEthiopiaEuro areaEurope & Central AsiaEurope & Central Asia (excluding high income)Europe & Central Asia (IDA & IBRD countries)European UnionFijiFinlandFragile and conflict affected situationsFranceGabonGambia, TheGeorgiaGermanyGhanaGreeceGrenadaGuatemalaGuineaGuinea-BissauGuyanaHaitiHeavily indebted poor countries (HIPC)High incomeHondurasHong Kong SAR, ChinaHungaryIBRD onlyIcelandIDA & IBRD totalIDA blendIDA onlyIDA totalIndiaIndonesiaIran, Islamic Rep.IraqIrelandIsraelItalyJamaicaJapanJordanKazakhstanKenyaKiribatiKorea, Dem. People’s Rep.Korea, Rep.KuwaitKyrgyz RepublicLao PDRLate-demographic dividendLatin America & Caribbean Latin America & Caribbean (excluding high income)Latin America & the Caribbean (IDA & IBRD countries)LatviaLeast developed countries: UN classificationLebanonLesothoLiberiaLibyaLiechtensteinLithuaniaLow & middle incomeLow incomeLower middle incomeLuxembourgMacao SAR, ChinaMacedonia, FYRMadagascarMalawiMaldivesMaliMaltaMarshall IslandsMauritaniaMauritiusMexicoMicronesia, Fed. Sts.Middle East & North AfricaMiddle East & North Africa (excluding high income)Middle East & North Africa (IDA & IBRD countries)Middle incomeMoldovaMongoliaMontenegroMoroccoMozambiqueMyanmarNamibiaNauruNepalNetherlandsNew ZealandNicaraguaNigerNigeriaNorth AmericaNorwayOECD membersOmanOther small statesPacific island small statesPakistanPalauPanamaPapua New GuineaParaguayPeruPhilippinesPolandPortugalPost-demographic dividendPre-demographic dividendPuerto RicoQatarRomaniaRussian FederationRwandaSamoaSan MarinoSao Tome and PrincipeSaudi ArabiaSenegalSerbiaSeychellesSierra LeoneSlovak RepublicSloveniaSmall statesSolomon IslandsSomaliaSouth AfricaSouth AsiaSouth Asia (IDA & IBRD)South SudanSpainSri LankaSt. Kitts and NevisSt. LuciaSt. Vincent and the GrenadinesSub-Saharan Africa Sub-Saharan Africa (excluding high income)Sub-Saharan Africa (IDA & IBRD countries)SudanSurinameSwazilandSwedenSwitzerlandSyrian Arab RepublicTajikistanTanzaniaThailandTimor-LesteTogoTongaTrinidad and TobagoTunisiaTurkeyTurkmenistanTuvaluUgandaUkraineUnited Arab EmiratesUnited KingdomUnited StatesUpper middle incomeUruguayUzbekistanVanuatuVenezuela, RBVietnamWest Bank and GazaWorldYemen, Rep.ZambiaZimbabwe línea de tiempo (timeline):
En esta escala de tiempo se presenta un gráfico de 1971 y 2015 de Indonesia. Los datos de 1970 están ausentes. El número de observaciones reales por fecha: 43.
Fuente (nombre):
Indicadores del desarrollo mundial
Fuente (organización):
United Nations Educational, Scientific, and Cultural Organization (UNESCO) Institute for Statistics.
Categorías:
Education, Gender
Se ha actualizado:
23 abr 2017 año
Los indicadores de los cambios de valor en los últimos años
Mínimo:
75.992
1 ene 1975 año
Máximo:
118.194
1 ene 1986 año
A la fecha de observación
Valor
Cambio absoluto
El cambio con respecto al valor anterior
1 ene 1971 año
77.382
+77.382
0.0%
1 ene 1972 año
77.435
+0.053
0.07%
1 ene 1973 año
78.518
+1.082
1.4%
1 ene 1974 año
77.997
-0.521
-0.66%
1 ene 1975 año
75.992
-2.005
-2.57%
1 ene 1976 año
80.348
+4.356
5.73%
1 ene 1977 año
84.065
+3.716
4.63%
1 ene 1978 año
86.366
+2.301
2.74%
1 ene 1979 año
93.894
+7.528
8.72%
1 ene 1982 año
102.692
+8.798
9.37%
1 ene 1983 año
108.447
+5.756
5.6%
1 ene 1984 año
113.344
+4.897
4.52%
1 ene 1985 año
116.398
+3.054
2.69%
1 ene 1986 año
118.194
+1.796
1.54%
1 ene 1987 año
116.122
-2.072
-1.75%
1 ene 1988 año
115.288
-0.834
-0.72%
1 ene 1989 año
114.325
-0.963
-0.84%
1 ene 1990 año
114.375
+0.05
0.04%
1 ene 1991 año
112.566
-1.809
-1.58%
1 ene 1992 año
111.764
-0.802
-0.71%
1 ene 1993 año
110.548
-1.216
-1.09%
1 ene 1994 año
108.931
-1.617
-1.46%
1 ene 1995 año
109.354
+0.423
0.39%
1 ene 1996 año
108.586
-0.768
-0.7%
1 ene 1997 año
108.018
-0.568
-0.52%
1 ene 1998 año
107.922
-0.096
-0.09%
1 ene 1999 año
107.518
-0.404
-0.37%
1 ene 2000 año
109.723
+2.206
2.05%
1 ene 2001 año
107.205
-2.518
-2.3%
1 ene 2002 año
108.471
+1.266
1.18%
1 ene 2003 año
108.686
+0.215
0.2%
1 ene 2004 año
108.48
-0.206
-0.19%
1 ene 2005 año
108.041
-0.439
-0.41%
1 ene 2006 año
106.09
-1.951
-1.81%
1 ene 2007 año
104.396
-1.694
-1.6%
1 ene 2008 año
107.018
+2.623
2.51%
1 ene 2009 año
106.508
-0.51
-0.48%
1 ene 2010 año
106.956
+0.448
0.42%
1 ene 2011 año
110.528
+3.572
3.34%
1 ene 2012 año
110.713
+0.185
0.17%
1 ene 2013 año
108.612
-2.102
-1.9%
1 ene 2014 año
106.235
-2.377
-2.19%
1 ene 2015 año
104.46
-1.775
-1.67%
Ranking de los países por los datos estadísticos actuales


Comentarios: