29
/es/
es
AIzaSyAYiBZKx7MnpbEhh9jyipgxe19OcubqV5w
April 1, 2024
232533
Samoa
WSM
true
2
1
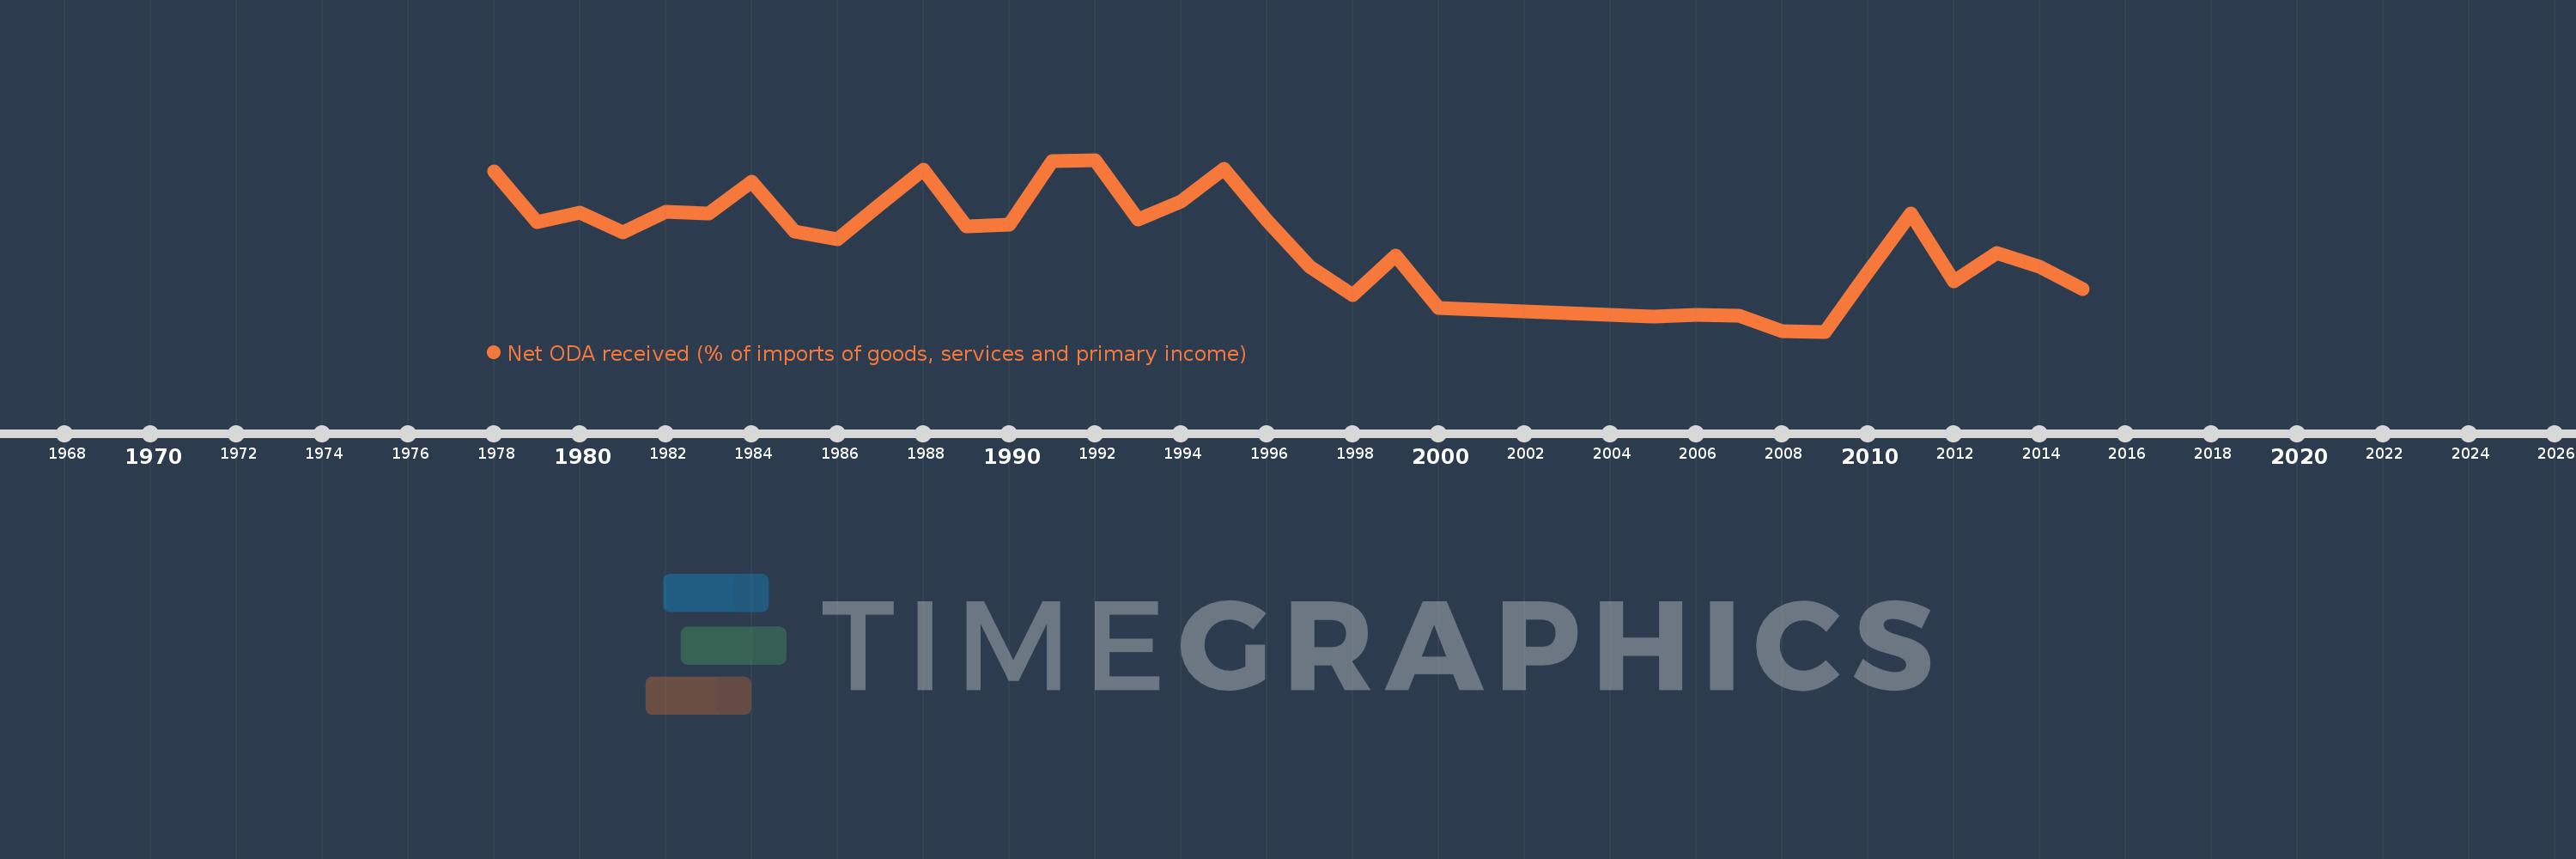
Net ODA received (% of imports of goods, services and primary income)
2015,2014,2013,2012,2011,2010,2009,2008,2007,2006,2005,2000,1999,1998,1997,1996,1995,1994,1993,1992,1991,1990,1989,1988,1987,1986,1985,1984,1983,1982,1981,1980,1979,1978
Estas estadísticas en otros países:
AfghanistanAlbaniaAlgeriaAngolaAntigua and BarbudaArab WorldArgentinaArmeniaArubaAzerbaijanBahamas, TheBahrainBangladeshBarbadosBelarusBelizeBeninBhutanBoliviaBosnia and HerzegovinaBotswanaBrazilBurkina FasoBurundiCabo VerdeCambodiaCameroonCaribbean small statesCentral African RepublicCentral Europe and the BalticsChadChileChinaColombiaComorosCongo, Dem. Rep.Congo, Rep.Costa RicaCote d'IvoireCroatiaCyprusDjiboutiDominicaDominican RepublicEast Asia & PacificEast Asia & Pacific (excluding high income)East Asia & Pacific (IDA & IBRD countries)EcuadorEgypt, Arab Rep.El SalvadorEquatorial GuineaEritreaEthiopiaEuro areaEurope & Central AsiaEurope & Central Asia (excluding high income)Europe & Central Asia (IDA & IBRD countries)European UnionFijiFragile and conflict affected situationsGabonGambia, TheGeorgiaGhanaGrenadaGuatemalaGuineaGuinea-BissauGuyanaHaitiHeavily indebted poor countries (HIPC)High incomeHondurasIBRD onlyIDA & IBRD totalIDA blendIDA onlyIDA totalIndiaIndonesiaIran, Islamic Rep.IraqIsraelJamaicaJordanKazakhstanKenyaKiribatiKorea, Rep.KosovoKuwaitKyrgyz RepublicLao PDRLatin America & Caribbean Latin America & Caribbean (excluding high income)Latin America & the Caribbean (IDA & IBRD countries)Least developed countries: UN classificationLebanonLesothoLiberiaLibyaLow & middle incomeLow incomeLower middle incomeMacedonia, FYRMadagascarMalawiMalaysiaMaldivesMaliMaltaMarshall IslandsMauritaniaMauritiusMexicoMicronesia, Fed. Sts.Middle East & North Africa (excluding high income)Middle East & North Africa (IDA & IBRD countries)Middle incomeMoldovaMongoliaMontenegroMoroccoMozambiqueMyanmarNamibiaNepalNicaraguaNigerNigeriaNorth AmericaOECD membersOmanOther small statesPacific island small statesPakistanPalauPanamaPapua New GuineaParaguayPeruPhilippinesRwandaSamoaSao Tome and PrincipeSaudi ArabiaSenegalSerbiaSeychellesSierra LeoneSingaporeSloveniaSmall statesSolomon IslandsSouth AfricaSouth AsiaSouth Asia (IDA & IBRD)South SudanSri LankaSt. Kitts and NevisSt. LuciaSt. Vincent and the GrenadinesSub-Saharan Africa Sub-Saharan Africa (excluding high income)Sub-Saharan Africa (IDA & IBRD countries)SudanSurinameSwazilandSyrian Arab RepublicTajikistanTanzaniaThailandTimor-LesteTogoTongaTrinidad and TobagoTunisiaTurkeyTuvaluUgandaUkraineUpper middle incomeUruguayVanuatuVenezuela, RBVietnamWest Bank and GazaWorldYemen, Rep.ZambiaZimbabwe línea de tiempo (timeline):
En esta escala de tiempo se presenta un gráfico de 1978 y 2015 de Samoa. Los datos de 1977 están ausentes. El número de observaciones reales por fecha: 34.
Fuente (nombre):
Indicadores del desarrollo mundial
Fuente (organización):
Development Assistance Committee of the Organisation for Economic Co-operation and Development, Geographical Distribution of Financial Flows to Developing Countries, Development Co-operation Report, and International Development Statistics database. Data are available online at: www.oecd.org/dac/stats/idsonline. World Bank imports of good and services estimates are used for the denominator.
Categorías:
Aid Effectiveness
Se ha actualizado:
23 abr 2017 año
Los indicadores de los cambios de valor en los últimos años
Mínimo:
10.697
1 ene 2009 año
Máximo:
49.671
1 ene 1992 año
A la fecha de observación
Valor
Cambio absoluto
El cambio con respecto al valor anterior
1 ene 1978 año
47.108
+47.108
0.0%
1 ene 1979 año
35.574
-11.535
-24.49%
1 ene 1980 año
37.691
+2.118
5.95%
1 ene 1981 año
33.202
-4.49
-11.91%
1 ene 1982 año
37.81
+4.609
13.88%
1 ene 1983 año
37.535
-0.276
-0.73%
1 ene 1984 año
44.735
+7.2
19.18%
1 ene 1985 año
33.383
-11.351
-25.37%
1 ene 1986 año
31.644
-1.739
-5.21%
1 ene 1987 año
39.579
+7.935
25.08%
1 ene 1988 año
47.458
+7.878
19.91%
1 ene 1989 año
34.473
-12.985
-27.36%
1 ene 1990 año
35.009
+0.536
1.56%
1 ene 1991 año
49.286
+14.277
40.78%
1 ene 1992 año
49.671
+0.386
0.78%
1 ene 1993 año
36.151
-13.521
-27.22%
1 ene 1994 año
40.292
+4.141
11.46%
1 ene 1995 año
47.591
+7.299
18.11%
1 ene 1996 año
36.028
-11.563
-24.3%
1 ene 1997 año
25.369
-10.659
-29.58%
1 ene 1998 año
18.991
-6.378
-25.14%
1 ene 1999 año
27.953
+8.963
47.19%
1 ene 2000 año
16.147
-11.806
-42.24%
1 ene 2005 año
14.088
-2.059
-12.75%
1 ene 2006 año
14.509
+0.421
2.99%
1 ene 2007 año
14.317
-0.192
-1.32%
1 ene 2008 año
10.881
-3.436
-24.0%
1 ene 2009 año
10.697
-0.184
-1.69%
1 ene 2010 año
24.175
+13.478
126.0%
1 ene 2011 año
37.574
+13.399
55.43%
1 ene 2012 año
22.053
-15.521
-41.31%
1 ene 2013 año
28.483
+6.43
29.16%
1 ene 2014 año
25.463
-3.02
-10.6%
1 ene 2015 año
20.363
-5.099
-20.03%
Ranking de los países por los datos estadísticos actuales


Comentarios: