29
/es/
es
AIzaSyAYiBZKx7MnpbEhh9jyipgxe19OcubqV5w
April 1, 2024
190624
Mali
MLI
true
2
1
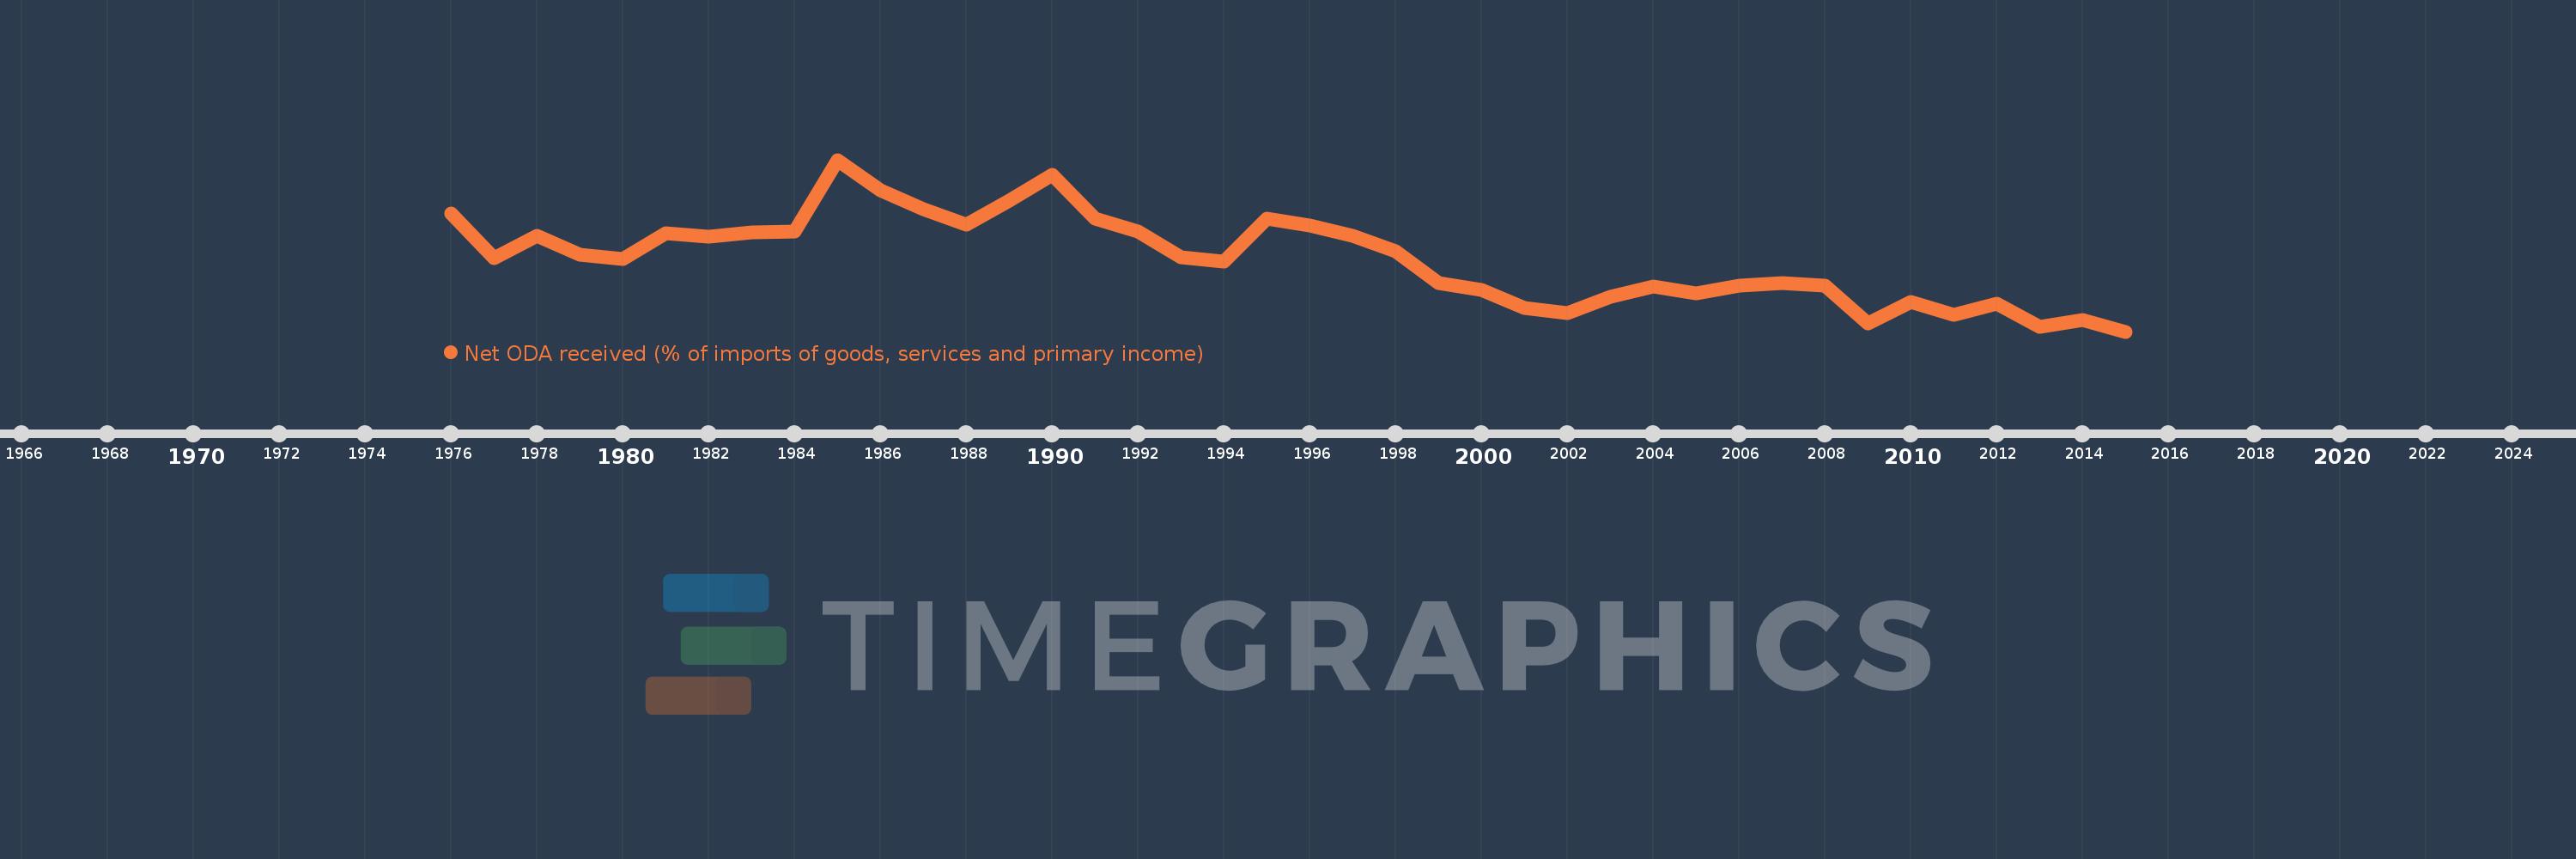
Net ODA received (% of imports of goods, services and primary income)
2015,2014,2013,2012,2011,2010,2009,2008,2007,2006,2005,2004,2003,2002,2001,2000,1999,1998,1997,1996,1995,1994,1993,1992,1991,1990,1989,1988,1987,1986,1985,1984,1983,1982,1981,1980,1979,1978,1977,1976
Estas estadísticas en otros países:
AfghanistanAlbaniaAlgeriaAngolaAntigua and BarbudaArab WorldArgentinaArmeniaArubaAzerbaijanBahamas, TheBahrainBangladeshBarbadosBelarusBelizeBeninBhutanBoliviaBosnia and HerzegovinaBotswanaBrazilBurkina FasoBurundiCabo VerdeCambodiaCameroonCaribbean small statesCentral African RepublicCentral Europe and the BalticsChadChileChinaColombiaComorosCongo, Dem. Rep.Congo, Rep.Costa RicaCote d'IvoireCroatiaCyprusDjiboutiDominicaDominican RepublicEast Asia & PacificEast Asia & Pacific (excluding high income)East Asia & Pacific (IDA & IBRD countries)EcuadorEgypt, Arab Rep.El SalvadorEquatorial GuineaEritreaEthiopiaEuro areaEurope & Central AsiaEurope & Central Asia (excluding high income)Europe & Central Asia (IDA & IBRD countries)European UnionFijiFragile and conflict affected situationsGabonGambia, TheGeorgiaGhanaGrenadaGuatemalaGuineaGuinea-BissauGuyanaHaitiHeavily indebted poor countries (HIPC)High incomeHondurasIBRD onlyIDA & IBRD totalIDA blendIDA onlyIDA totalIndiaIndonesiaIran, Islamic Rep.IraqIsraelJamaicaJordanKazakhstanKenyaKiribatiKorea, Rep.KosovoKuwaitKyrgyz RepublicLao PDRLatin America & Caribbean Latin America & Caribbean (excluding high income)Latin America & the Caribbean (IDA & IBRD countries)Least developed countries: UN classificationLebanonLesothoLiberiaLibyaLow & middle incomeLow incomeLower middle incomeMacedonia, FYRMadagascarMalawiMalaysiaMaldivesMaliMaltaMarshall IslandsMauritaniaMauritiusMexicoMicronesia, Fed. Sts.Middle East & North Africa (excluding high income)Middle East & North Africa (IDA & IBRD countries)Middle incomeMoldovaMongoliaMontenegroMoroccoMozambiqueMyanmarNamibiaNepalNicaraguaNigerNigeriaNorth AmericaOECD membersOmanOther small statesPacific island small statesPakistanPalauPanamaPapua New GuineaParaguayPeruPhilippinesRwandaSamoaSao Tome and PrincipeSaudi ArabiaSenegalSerbiaSeychellesSierra LeoneSingaporeSloveniaSmall statesSolomon IslandsSouth AfricaSouth AsiaSouth Asia (IDA & IBRD)South SudanSri LankaSt. Kitts and NevisSt. LuciaSt. Vincent and the GrenadinesSub-Saharan Africa Sub-Saharan Africa (excluding high income)Sub-Saharan Africa (IDA & IBRD countries)SudanSurinameSwazilandSyrian Arab RepublicTajikistanTanzaniaThailandTimor-LesteTogoTongaTrinidad and TobagoTunisiaTurkeyTuvaluUgandaUkraineUpper middle incomeUruguayVanuatuVenezuela, RBVietnamWest Bank and GazaWorldYemen, Rep.ZambiaZimbabwe línea de tiempo (timeline):
En esta escala de tiempo se presenta un gráfico de 1976 y 2015 de Mali. Los datos de 1975 están ausentes. El número de observaciones reales por fecha: 40.
Fuente (nombre):
Indicadores del desarrollo mundial
Fuente (organización):
Development Assistance Committee of the Organisation for Economic Co-operation and Development, Geographical Distribution of Financial Flows to Developing Countries, Development Co-operation Report, and International Development Statistics database. Data are available online at: www.oecd.org/dac/stats/idsonline. World Bank imports of good and services estimates are used for the denominator.
Categorías:
Aid Effectiveness
Se ha actualizado:
23 abr 2017 año
Los indicadores de los cambios de valor en los últimos años
Mínimo:
20.76
1 ene 2015 año
Máximo:
71.027
1 ene 1985 año
A la fecha de observación
Valor
Cambio absoluto
El cambio con respecto al valor anterior
1 ene 1976 año
55.3
+55.3
0.0%
1 ene 1977 año
42.136
-13.164
-23.8%
1 ene 1978 año
48.685
+6.549
15.54%
1 ene 1979 año
43.227
-5.458
-11.21%
1 ene 1980 año
42.058
-1.169
-2.7%
1 ene 1981 año
49.609
+7.551
17.95%
1 ene 1982 año
48.46
-1.149
-2.32%
1 ene 1983 año
49.783
+1.322
2.73%
1 ene 1984 año
50.165
+0.382
0.77%
1 ene 1985 año
71.027
+20.862
41.59%
1 ene 1986 año
61.986
-9.041
-12.73%
1 ene 1987 año
56.478
-5.507
-8.88%
1 ene 1988 año
52.161
-4.317
-7.64%
1 ene 1989 año
59.087
+6.925
13.28%
1 ene 1990 año
66.592
+7.506
12.7%
1 ene 1991 año
53.907
-12.685
-19.05%
1 ene 1992 año
49.948
-3.959
-7.34%
1 ene 1993 año
42.483
-7.465
-14.95%
1 ene 1994 año
41.215
-1.267
-2.98%
1 ene 1995 año
53.887
+12.671
30.74%
1 ene 1996 año
51.902
-1.985
-3.68%
1 ene 1997 año
48.752
-3.15
-6.07%
1 ene 1998 año
44.364
-4.388
-9.0%
1 ene 1999 año
34.962
-9.403
-21.19%
1 ene 2000 año
32.843
-2.118
-6.06%
1 ene 2001 año
27.57
-5.273
-16.06%
1 ene 2002 año
26.171
-1.399
-5.07%
1 ene 2003 año
30.889
+4.718
18.03%
1 ene 2004 año
33.853
+2.964
9.59%
1 ene 2005 año
31.887
-1.966
-5.81%
1 ene 2006 año
34.216
+2.329
7.3%
1 ene 2007 año
34.964
+0.748
2.19%
1 ene 2008 año
34.122
-0.842
-2.41%
1 ene 2009 año
23.112
-11.01
-32.27%
1 ene 2010 año
29.377
+6.265
27.11%
1 ene 2011 año
25.709
-3.668
-12.49%
1 ene 2012 año
28.994
+3.285
12.78%
1 ene 2013 año
22.111
-6.883
-23.74%
1 ene 2014 año
24.125
+2.013
9.11%
1 ene 2015 año
20.76
-3.364
-13.95%
Ranking de los países por los datos estadísticos actuales


Comentarios: