29
/es/
es
AIzaSyAYiBZKx7MnpbEhh9jyipgxe19OcubqV5w
April 1, 2024
225925
Portugal
PRT
true
2
1
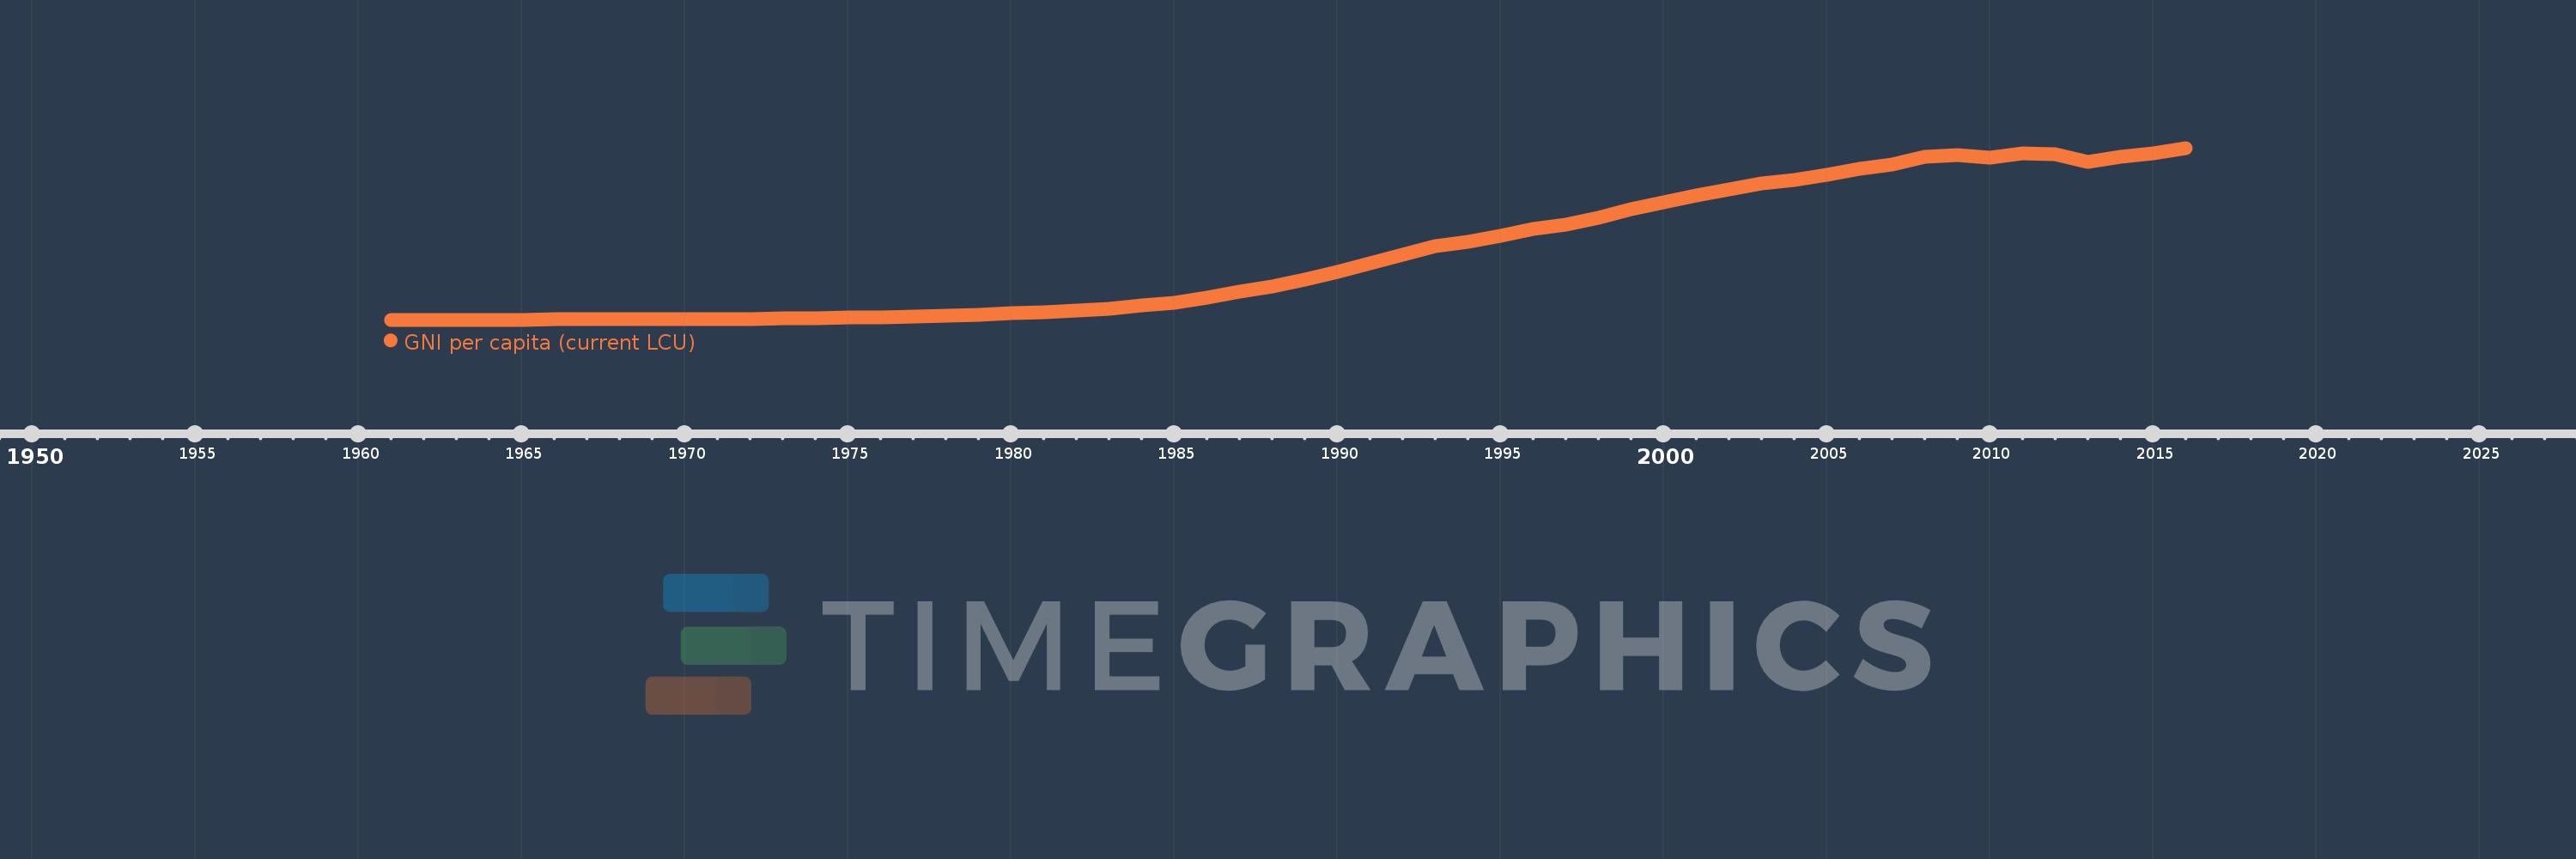
GNI per capita (current LCU)
2016,2015,2014,2013,2012,2011,2010,2009,2008,2007,2006,2005,2004,2003,2002,2001,2000,1999,1998,1997,1996,1995,1994,1993,1992,1991,1990,1989,1988,1987,1986,1985,1984,1983,1982,1981,1980,1979,1978,1977,1976,1975,1974,1973,1972,1971,1970,1969,1968,1967,1966,1965,1964,1963,1962,1961
Estas estadísticas en otros países:
AfghanistanAlbaniaAlgeriaAmerican SamoaAndorraAngolaAntigua and BarbudaArgentinaArmeniaAustraliaAustriaAzerbaijanBahamas, TheBahrainBangladeshBarbadosBelarusBelgiumBelizeBeninBermudaBhutanBoliviaBosnia and HerzegovinaBotswanaBrazilBrunei DarussalamBulgariaBurkina FasoBurundiCabo VerdeCambodiaCameroonCanadaCentral African RepublicChadChannel IslandsChileChinaColombiaComorosCongo, Dem. Rep.Congo, Rep.Costa RicaCote d'IvoireCroatiaCubaCyprusCzech RepublicDenmarkDjiboutiDominicaDominican RepublicEcuadorEgypt, Arab Rep.El SalvadorEquatorial GuineaEritreaEstoniaEthiopiaFaroe IslandsFijiFinlandFranceFrench PolynesiaGabonGambia, TheGeorgiaGermanyGhanaGreeceGreenlandGrenadaGuamGuatemalaGuineaGuinea-BissauGuyanaHaitiHondurasHong Kong SAR, ChinaHungaryIcelandIndiaIndonesiaIran, Islamic Rep.IraqIrelandIsle of ManIsraelItalyJamaicaJapanJordanKazakhstanKenyaKiribatiKorea, Rep.KosovoKuwaitKyrgyz RepublicLao PDRLatviaLebanonLesothoLiberiaLibyaLiechtensteinLithuaniaLuxembourgMacao SAR, ChinaMacedonia, FYRMadagascarMalawiMalaysiaMaldivesMaliMaltaMarshall IslandsMauritaniaMauritiusMexicoMicronesia, Fed. Sts.MoldovaMonacoMongoliaMontenegroMoroccoMozambiqueMyanmarNamibiaNauruNepalNetherlandsNew CaledoniaNew ZealandNicaraguaNigerNigeriaNorwayOmanPakistanPalauPanamaPapua New GuineaParaguayPeruPhilippinesPolandPortugalPuerto RicoQatarRomaniaRussian FederationRwandaSamoaSan MarinoSao Tome and PrincipeSaudi ArabiaSenegalSerbiaSeychellesSierra LeoneSingaporeSlovak RepublicSloveniaSolomon IslandsSomaliaSouth AfricaSouth SudanSpainSri LankaSt. Kitts and NevisSt. LuciaSt. Vincent and the GrenadinesSudanSurinameSwazilandSwedenSwitzerlandSyrian Arab RepublicTajikistanTanzaniaThailandTimor-LesteTogoTongaTrinidad and TobagoTunisiaTurkeyTurkmenistanTuvaluUgandaUkraineUnited Arab EmiratesUnited KingdomUnited StatesUruguayUzbekistanVanuatuVenezuela, RBVietnamVirgin Islands (U.S.)West Bank and GazaYemen, Rep.ZambiaZimbabwe línea de tiempo (timeline):
En esta escala de tiempo se presenta un gráfico de 1961 y 2016 de Portugal. Los datos de 1960 están ausentes. El número de observaciones reales por fecha: 56.
Fuente (nombre):
Indicadores del desarrollo mundial
Fuente (organización):
World Bank national accounts data, and OECD National Accounts data files.
Categorías:
Economy & Growth
Se ha actualizado:
23 abr 2017 año
Los indicadores de los cambios de valor en los últimos años
Mínimo:
50.904
1 ene 1961 año
Máximo:
16.963 mil
1 ene 2016 año
A la fecha de observación
Valor
Cambio absoluto
El cambio con respecto al valor anterior
1 ene 1961 año
50.904
+50.904
0.0%
1 ene 1962 año
53.973
+3.069
6.03%
1 ene 1963 año
57.452
+3.479
6.45%
1 ene 1964 año
61.004
+3.551
6.18%
1 ene 1965 año
66.606
+5.603
9.18%
1 ene 1966 año
74.746
+8.14
12.22%
1 ene 1967 año
82.144
+7.398
9.9%
1 ene 1968 año
92.613
+10.469
12.74%
1 ene 1969 año
102.917
+10.304
11.13%
1 ene 1970 año
114.138
+11.221
10.9%
1 ene 1971 año
135.185
+21.047
18.44%
1 ene 1972 año
151.582
+16.397
12.13%
1 ene 1973 año
176.856
+25.274
16.67%
1 ene 1974 año
216.287
+39.431
22.3%
1 ene 1975 año
256.985
+40.698
18.82%
1 ene 1976 año
272.148
+15.163
5.9%
1 ene 1977 año
326.28
+54.132
19.89%
1 ene 1978 año
429.877
+103.597
31.75%
1 ene 1979 año
530.998
+101.122
23.52%
1 ene 1980 año
661.099
+130.101
24.5%
1 ene 1981 año
824.06
+162.961
24.65%
1 ene 1982 año
960.819
+136.759
16.6%
1 ene 1983 año
1.158 mil
+196.877
20.49%
1 ene 1984 año
1.439 mil
+281.237
24.29%
1 ene 1985 año
1.736 mil
+296.832
20.63%
1 ene 1986 año
2.184 mil
+447.818
25.8%
1 ene 1987 año
2.795 mil
+611.268
27.99%
1 ene 1988 año
3.31 mil
+514.765
18.42%
1 ene 1989 año
3.99 mil
+679.901
20.54%
1 ene 1990 año
4.724 mil
+734.213
18.4%
1 ene 1991 año
5.605 mil
+881.697
18.67%
1 ene 1992 año
6.47 mil
+864.142
15.42%
1 ene 1993 año
7.328 mil
+858.769
13.27%
1 ene 1994 año
7.705 mil
+376.769
5.14%
1 ene 1995 año
8.288 mil
+582.741
7.56%
1 ene 1996 año
8.952 mil
+663.805
8.01%
1 ene 1997 año
9.41 mil
+458.575
5.12%
1 ene 1998 año
10.088 mil
+677.973
7.2%
1 ene 1999 año
10.906 mil
+817.547
8.1%
1 ene 2000 año
11.649 mil
+743.387
6.82%
1 ene 2001 año
12.247 mil
+597.755
5.13%
1 ene 2002 año
12.844 mil
+597.438
4.88%
1 ene 2003 año
13.449 mil
+604.99
4.71%
1 ene 2004 año
13.799 mil
+349.923
2.6%
1 ene 2005 año
14.316 mil
+517.003
3.75%
1 ene 2006 año
14.872 mil
+556.113
3.88%
1 ene 2007 año
15.298 mil
+425.381
2.86%
1 ene 2008 año
16.113 mil
+814.823
5.33%
1 ene 2009 año
16.282 mil
+169.587
1.05%
1 ene 2010 año
15.994 mil
-288.565
-1.77%
1 ene 2011 año
16.445 mil
+451.774
2.82%
1 ene 2012 año
16.365 mil
-80.558
-0.49%
1 ene 2013 año
15.627 mil
-737.698
-4.51%
1 ene 2014 año
16.063 mil
+435.803
2.79%
1 ene 2015 año
16.401 mil
+338.46
2.11%
1 ene 2016 año
16.963 mil
+561.821
3.43%
Ranking de los países por los datos estadísticos actuales


Comentarios: