29
/es/
es
AIzaSyAYiBZKx7MnpbEhh9jyipgxe19OcubqV5w
April 1, 2024
130483
Ethiopia
ETH
true
2
1
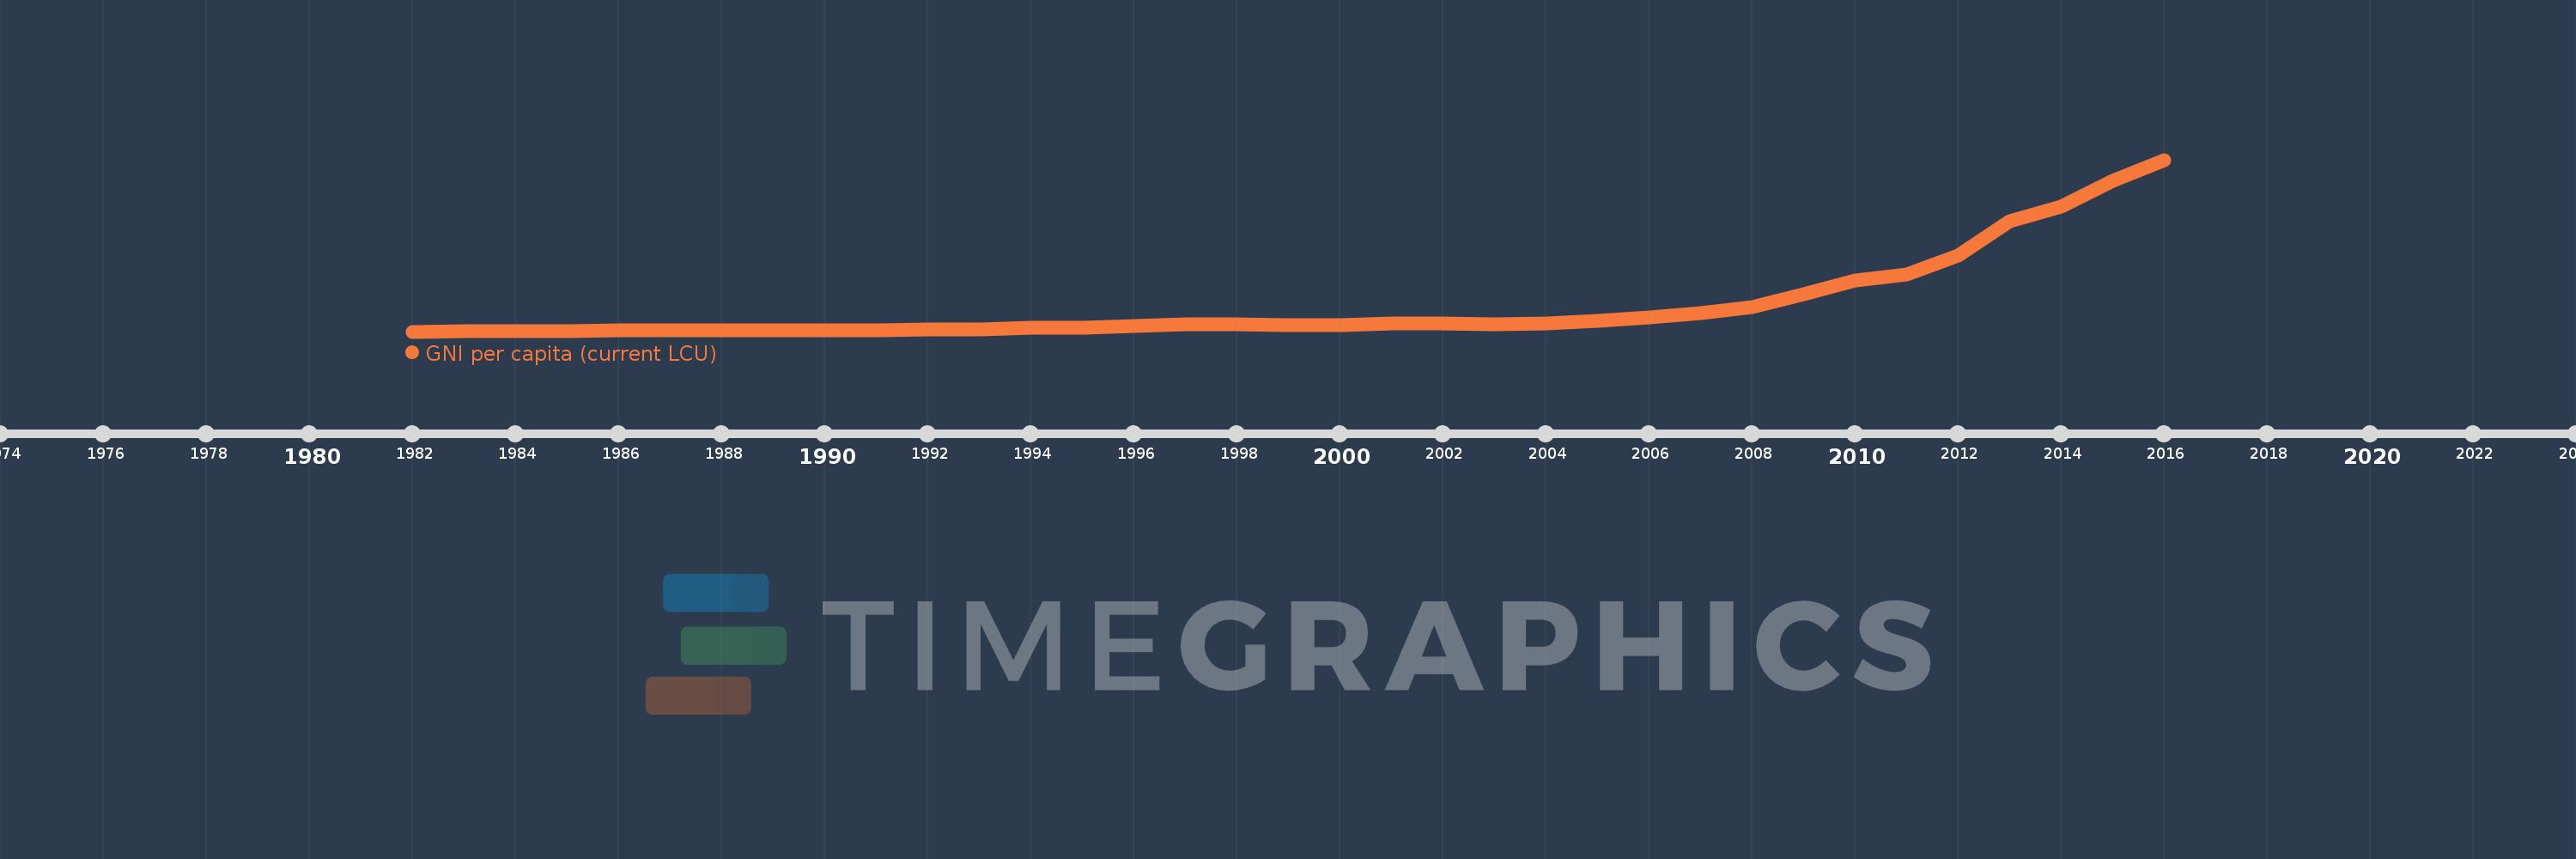
GNI per capita (current LCU)
2016,2015,2014,2013,2012,2011,2010,2009,2008,2007,2006,2005,2004,2003,2002,2001,2000,1999,1998,1997,1996,1995,1994,1993,1992,1991,1990,1989,1988,1987,1986,1985,1984,1983,1982
Estas estadísticas en otros países:
AfghanistanAlbaniaAlgeriaAmerican SamoaAndorraAngolaAntigua and BarbudaArgentinaArmeniaAustraliaAustriaAzerbaijanBahamas, TheBahrainBangladeshBarbadosBelarusBelgiumBelizeBeninBermudaBhutanBoliviaBosnia and HerzegovinaBotswanaBrazilBrunei DarussalamBulgariaBurkina FasoBurundiCabo VerdeCambodiaCameroonCanadaCentral African RepublicChadChannel IslandsChileChinaColombiaComorosCongo, Dem. Rep.Congo, Rep.Costa RicaCote d'IvoireCroatiaCubaCyprusCzech RepublicDenmarkDjiboutiDominicaDominican RepublicEcuadorEgypt, Arab Rep.El SalvadorEquatorial GuineaEritreaEstoniaEthiopiaFaroe IslandsFijiFinlandFranceFrench PolynesiaGabonGambia, TheGeorgiaGermanyGhanaGreeceGreenlandGrenadaGuamGuatemalaGuineaGuinea-BissauGuyanaHaitiHondurasHong Kong SAR, ChinaHungaryIcelandIndiaIndonesiaIran, Islamic Rep.IraqIrelandIsle of ManIsraelItalyJamaicaJapanJordanKazakhstanKenyaKiribatiKorea, Rep.KosovoKuwaitKyrgyz RepublicLao PDRLatviaLebanonLesothoLiberiaLibyaLiechtensteinLithuaniaLuxembourgMacao SAR, ChinaMacedonia, FYRMadagascarMalawiMalaysiaMaldivesMaliMaltaMarshall IslandsMauritaniaMauritiusMexicoMicronesia, Fed. Sts.MoldovaMonacoMongoliaMontenegroMoroccoMozambiqueMyanmarNamibiaNauruNepalNetherlandsNew CaledoniaNew ZealandNicaraguaNigerNigeriaNorwayOmanPakistanPalauPanamaPapua New GuineaParaguayPeruPhilippinesPolandPortugalPuerto RicoQatarRomaniaRussian FederationRwandaSamoaSan MarinoSao Tome and PrincipeSaudi ArabiaSenegalSerbiaSeychellesSierra LeoneSingaporeSlovak RepublicSloveniaSolomon IslandsSomaliaSouth AfricaSouth SudanSpainSri LankaSt. Kitts and NevisSt. LuciaSt. Vincent and the GrenadinesSudanSurinameSwazilandSwedenSwitzerlandSyrian Arab RepublicTajikistanTanzaniaThailandTimor-LesteTogoTongaTrinidad and TobagoTunisiaTurkeyTurkmenistanTuvaluUgandaUkraineUnited Arab EmiratesUnited KingdomUnited StatesUruguayUzbekistanVanuatuVenezuela, RBVietnamVirgin Islands (U.S.)West Bank and GazaYemen, Rep.ZambiaZimbabwe línea de tiempo (timeline):
En esta escala de tiempo se presenta un gráfico de 1982 y 2016 de Ethiopia. Los datos de 1981 están ausentes. El número de observaciones reales por fecha: 35.
Fuente (nombre):
Indicadores del desarrollo mundial
Fuente (organización):
World Bank national accounts data, and OECD National Accounts data files.
Categorías:
Economy & Growth
Se ha actualizado:
23 abr 2017 año
Los indicadores de los cambios de valor en los últimos años
Mínimo:
419.688
1 ene 1982 año
Máximo:
12.39 mil
1 ene 2016 año
A la fecha de observación
Valor
Cambio absoluto
El cambio con respecto al valor anterior
1 ene 1982 año
419.688
+419.688
0.0%
1 ene 1983 año
429.45
+9.762
2.33%
1 ene 1984 año
462.829
+33.378
7.77%
1 ene 1985 año
423.334
-39.495
-8.53%
1 ene 1986 año
479.614
+56.28
13.29%
1 ene 1987 año
482.738
+3.124
0.65%
1 ene 1988 año
499.045
+16.308
3.38%
1 ene 1989 año
499.854
+0.809
0.16%
1 ene 1990 año
508.042
+8.188
1.64%
1 ene 1991 año
521.542
+13.5
2.66%
1 ene 1992 año
556.757
+35.215
6.75%
1 ene 1993 año
566.401
+9.644
1.73%
1 ene 1994 año
697.687
+131.286
23.18%
1 ene 1995 año
715.355
+17.668
2.53%
1 ene 1996 año
830.694
+115.339
16.12%
1 ene 1997 año
909.552
+78.859
9.49%
1 ene 1998 año
906.277
-3.276
-0.36%
1 ene 1999 año
850.742
-55.534
-6.13%
1 ene 2000 año
889.943
+39.2
4.61%
1 ene 2001 año
1.003 mil
+113.463
12.75%
1 ene 2002 año
996.035
-7.37
-0.73%
1 ene 2003 año
946.272
-49.763
-5.0%
1 ene 2004 año
1.014 mil
+67.479
7.13%
1 ene 2005 año
1.165 mil
+150.947
14.89%
1 ene 2006 año
1.396 mil
+231.755
19.9%
1 ene 2007 año
1.681 mil
+284.085
20.34%
1 ene 2008 año
2.144 mil
+463.477
27.58%
1 ene 2009 año
3.014 mil
+869.852
40.57%
1 ene 2010 año
3.957 mil
+943.026
31.29%
1 ene 2011 año
4.391 mil
+434.08
10.97%
1 ene 2012 año
5.72 mil
+1.329 mil
30.26%
1 ene 2013 año
8.088 mil
+2.369 mil
41.41%
1 ene 2014 año
9.148 mil
+1.059 mil
13.1%
1 ene 2015 año
10.911 mil
+1.763 mil
19.28%
1 ene 2016 año
12.39 mil
+1.479 mil
13.55%
Ranking de los países por los datos estadísticos actuales


Comentarios: