29
/es/
es
AIzaSyAYiBZKx7MnpbEhh9jyipgxe19OcubqV5w
April 1, 2024
224968
Poland
POL
true
2
1
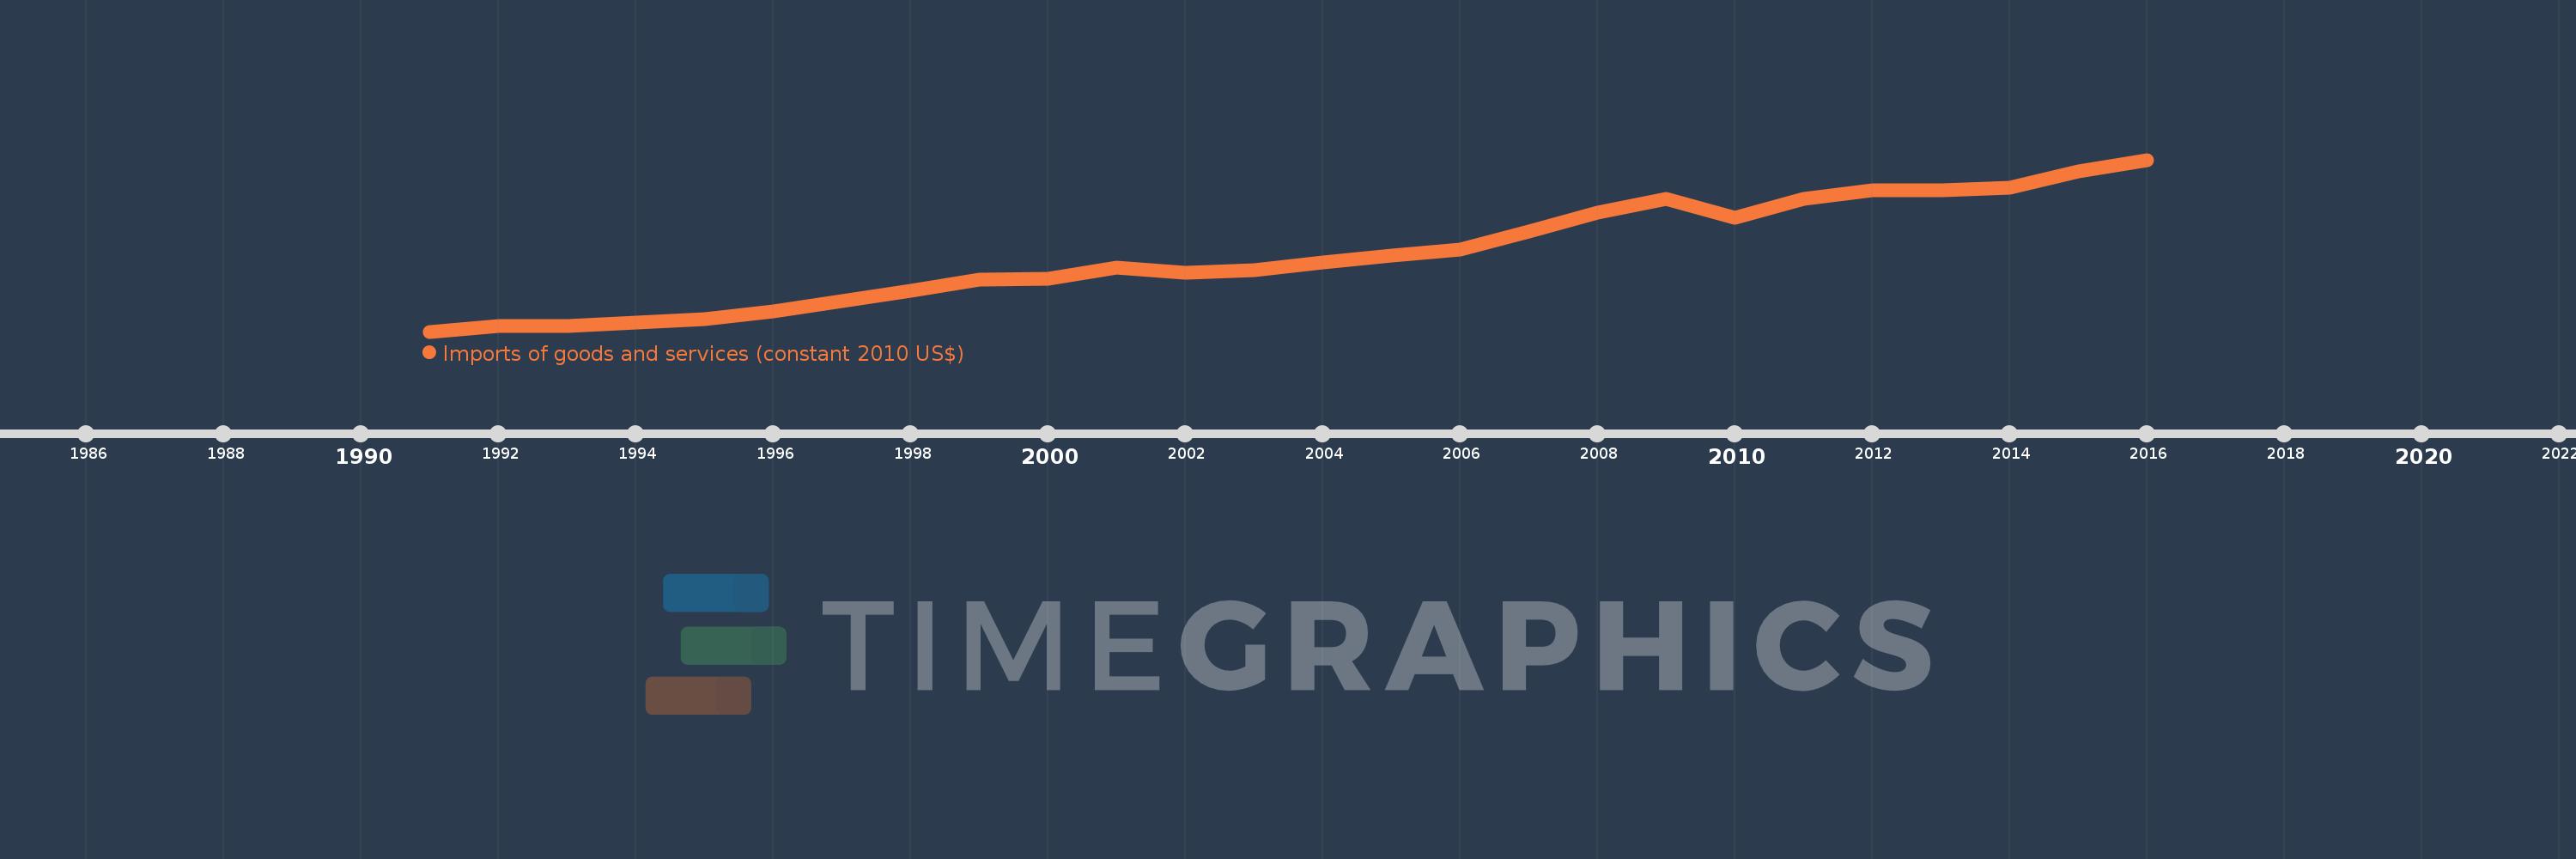
Imports of goods and services (constant 2010 US$)
2016,2015,2014,2013,2012,2011,2010,2009,2008,2007,2006,2005,2004,2003,2002,2001,2000,1999,1998,1997,1996,1995,1994,1993,1992,1991
Estas estadísticas en otros países:
AfghanistanAlbaniaAlgeriaAngolaAntigua and BarbudaArab WorldArgentinaArmeniaArubaAustraliaAustriaAzerbaijanBahamas, TheBahrainBangladeshBarbadosBelarusBelgiumBelizeBeninBermudaBhutanBoliviaBosnia and HerzegovinaBotswanaBrazilBrunei DarussalamBulgariaBurkina FasoBurundiCabo VerdeCambodiaCameroonCanadaCaribbean small statesCentral African RepublicCentral Europe and the BalticsChadChileChinaColombiaComorosCongo, Dem. Rep.Congo, Rep.Costa RicaCote d'IvoireCroatiaCubaCyprusCzech RepublicDenmarkDominicaDominican RepublicEarly-demographic dividendEast Asia & PacificEast Asia & Pacific (excluding high income)East Asia & Pacific (IDA & IBRD countries)EcuadorEgypt, Arab Rep.El SalvadorEquatorial GuineaEritreaEstoniaEuro areaEurope & Central AsiaEurope & Central Asia (excluding high income)Europe & Central Asia (IDA & IBRD countries)European UnionFaroe IslandsFijiFinlandFragile and conflict affected situationsFranceGabonGambia, TheGeorgiaGermanyGhanaGreeceGrenadaGuatemalaGuineaGuinea-BissauGuyanaHaitiHeavily indebted poor countries (HIPC)High incomeHondurasHong Kong SAR, ChinaHungaryIBRD onlyIcelandIDA & IBRD totalIDA blendIDA onlyIDA totalIndiaIndonesiaIran, Islamic Rep.IraqIrelandIsraelItalyJamaicaJapanJordanKazakhstanKenyaKiribatiKorea, Rep.KosovoKuwaitKyrgyz RepublicLao PDRLate-demographic dividendLatin America & Caribbean Latin America & Caribbean (excluding high income)Latin America & the Caribbean (IDA & IBRD countries)LatviaLeast developed countries: UN classificationLebanonLiberiaLibyaLithuaniaLow & middle incomeLow incomeLower middle incomeLuxembourgMacao SAR, ChinaMacedonia, FYRMadagascarMalawiMalaysiaMaldivesMaliMaltaMauritaniaMauritiusMexicoMiddle East & North AfricaMiddle East & North Africa (excluding high income)Middle East & North Africa (IDA & IBRD countries)Middle incomeMoldovaMongoliaMontenegroMoroccoMozambiqueMyanmarNamibiaNepalNetherlandsNew ZealandNicaraguaNigerNigeriaNorth AmericaNorwayOECD membersOmanOther small statesPacific island small statesPakistanPalauPanamaParaguayPeruPhilippinesPolandPortugalPost-demographic dividendPre-demographic dividendPuerto RicoQatarRomaniaRussian FederationRwandaSamoaSaudi ArabiaSenegalSerbiaSeychellesSierra LeoneSingaporeSlovak RepublicSloveniaSmall statesSolomon IslandsSouth AfricaSouth AsiaSouth Asia (IDA & IBRD)South SudanSpainSri LankaSt. Kitts and NevisSt. LuciaSt. Vincent and the GrenadinesSub-Saharan Africa Sub-Saharan Africa (excluding high income)Sub-Saharan Africa (IDA & IBRD countries)SudanSurinameSwazilandSwedenSwitzerlandTajikistanTanzaniaThailandTimor-LesteTogoTongaTrinidad and TobagoTunisiaTurkeyTurkmenistanUgandaUkraineUnited Arab EmiratesUnited KingdomUnited StatesUpper middle incomeUruguayUzbekistanVanuatuVenezuela, RBVietnamWest Bank and GazaWorldYemen, Rep.ZambiaZimbabwe línea de tiempo (timeline):
En esta escala de tiempo se presenta un gráfico de 1991 y 2016 de Poland. Los datos de 1990 están ausentes. El número de observaciones reales por fecha: 26.
Fuente (nombre):
Indicadores del desarrollo mundial
Fuente (organización):
World Bank national accounts data, and OECD National Accounts data files.
Categorías:
Economy & Growth, Trade
Se ha actualizado:
23 abr 2017 año
Los indicadores de los cambios de valor en los últimos años
Mínimo:
24.847 bn
1 ene 1991 año
Máximo:
253.637 bn
1 ene 2016 año
A la fecha de observación
Valor
Cambio absoluto
El cambio con respecto al valor anterior
1 ene 1991 año
24.847 bn
+24.847 bn
0.0%
1 ene 1992 año
32.221 bn
+7.374 bn
29.68%
1 ene 1993 año
32.785 bn
+564.385 millones
1.75%
1 ene 1994 año
37.095 bn
+4.31 bn
13.15%
1 ene 1995 año
41.302 bn
+4.207 bn
11.34%
1 ene 1996 año
51.307 bn
+10.005 bn
24.22%
1 ene 1997 año
65.275 bn
+13.969 bn
27.23%
1 ene 1998 año
79.168 bn
+13.893 bn
21.28%
1 ene 1999 año
93.859 bn
+14.691 bn
18.56%
1 ene 2000 año
94.863 bn
+1.005 bn
1.07%
1 ene 2001 año
109.551 bn
+14.687 bn
15.48%
1 ene 2002 año
103.774 bn
-5.777 bn
-5.27%
1 ene 2003 año
106.661 bn
+2.887 bn
2.78%
1 ene 2004 año
116.912 bn
+10.251 bn
9.61%
1 ene 2005 año
126.402 bn
+9.489 bn
8.12%
1 ene 2006 año
134.318 bn
+7.917 bn
6.26%
1 ene 2007 año
158.655 bn
+24.337 bn
18.12%
1 ene 2008 año
183.705 bn
+25.049 bn
15.79%
1 ene 2009 año
201.205 bn
+17.5 bn
9.53%
1 ene 2010 año
176.288 bn
-24.917 bn
-12.38%
1 ene 2011 año
201.57 bn
+25.282 bn
14.34%
1 ene 2012 año
213.279 bn
+11.709 bn
5.81%
1 ene 2013 año
212.693 bn
-586.749 millones
-0.28%
1 ene 2014 año
216.268 bn
+3.576 bn
1.68%
1 ene 2015 año
237.916 bn
+21.647 bn
10.01%
1 ene 2016 año
253.637 bn
+15.721 bn
6.61%
Ranking de los países por los datos estadísticos actuales


Comentarios: