29
/es/
es
AIzaSyAYiBZKx7MnpbEhh9jyipgxe19OcubqV5w
April 1, 2024
224308
Philippines
PHL
true
2
1
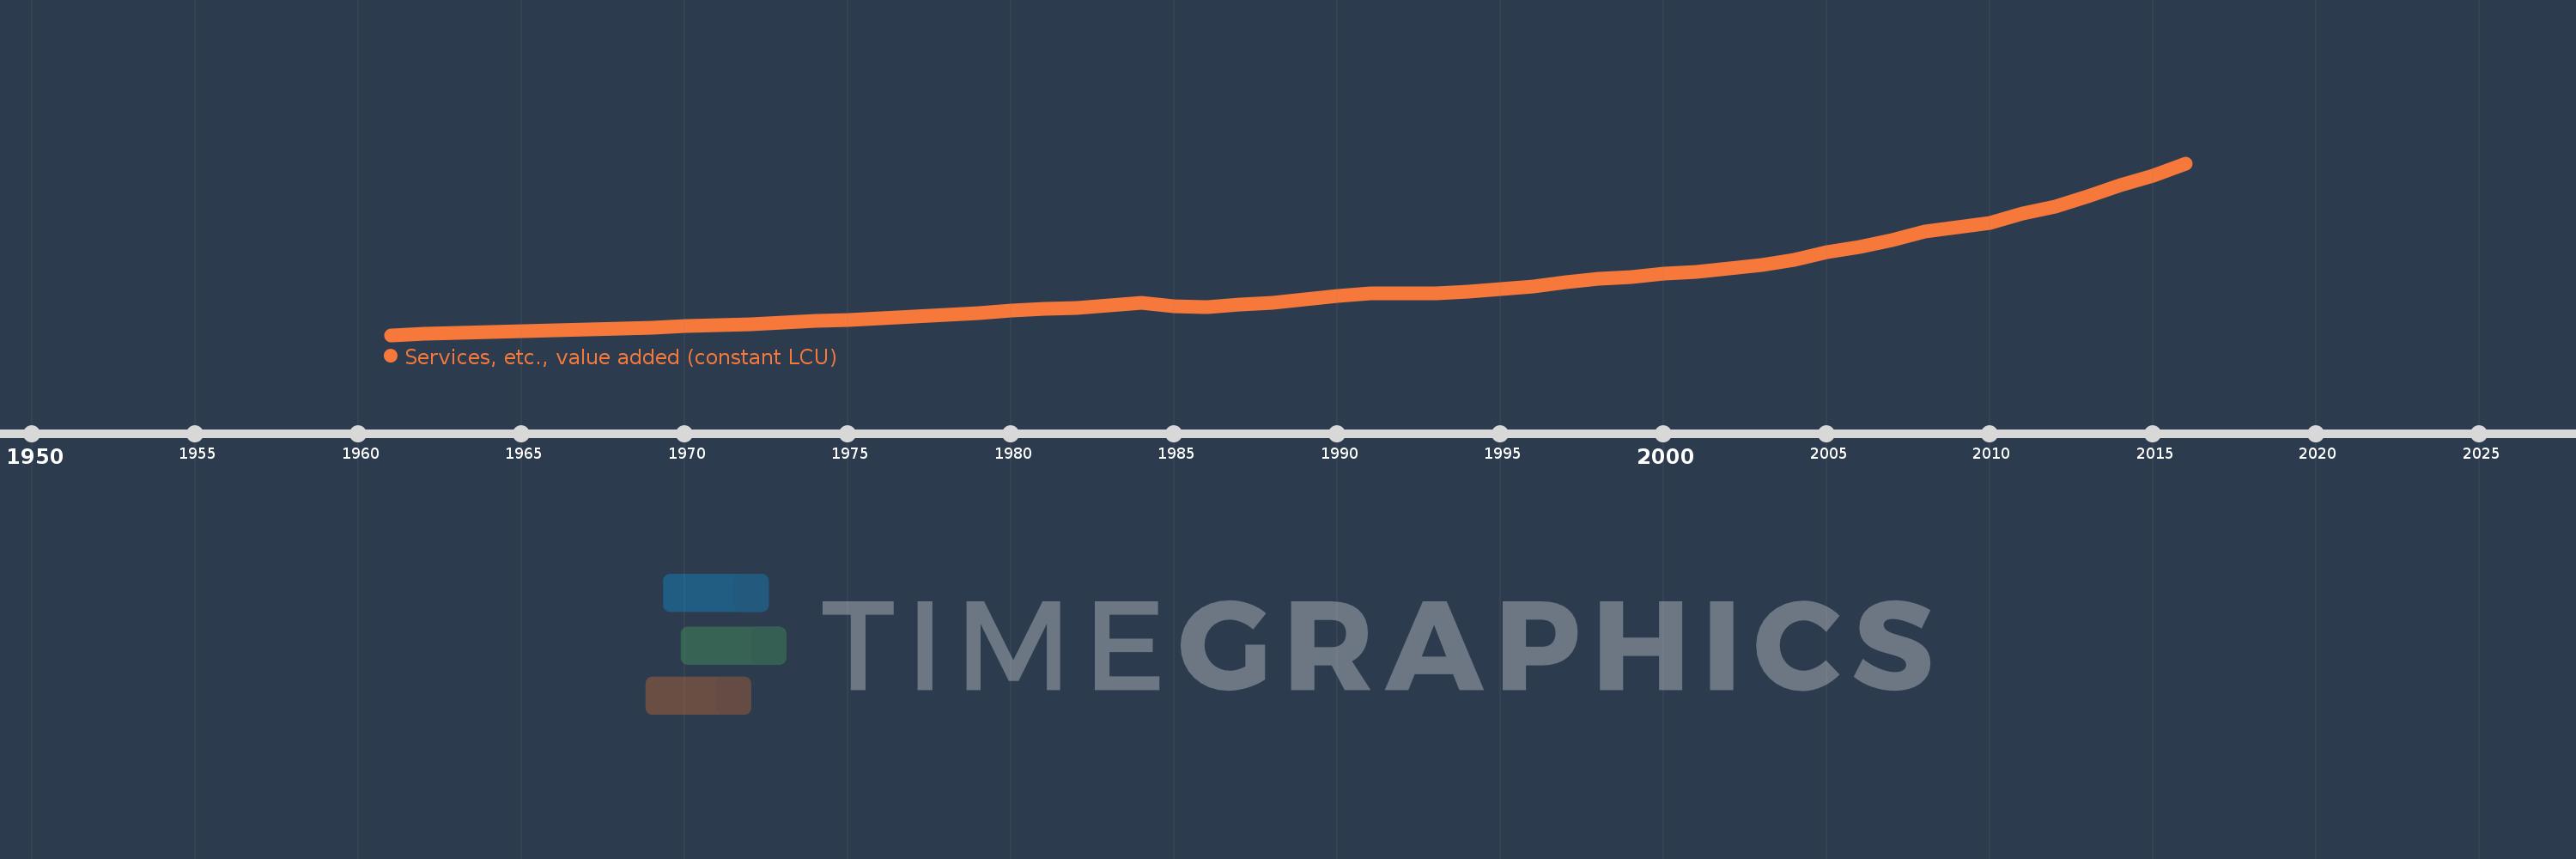
Services, etc., value added (constant LCU)
2016,2015,2014,2013,2012,2011,2010,2009,2008,2007,2006,2005,2004,2003,2002,2001,2000,1999,1998,1997,1996,1995,1994,1993,1992,1991,1990,1989,1988,1987,1986,1985,1984,1983,1982,1981,1980,1979,1978,1977,1976,1975,1974,1973,1972,1971,1970,1969,1968,1967,1966,1965,1964,1963,1962,1961
Estas estadísticas en otros países:
AfghanistanAlbaniaAlgeriaAntigua and BarbudaArgentinaArmeniaAustraliaAustriaAzerbaijanBahamas, TheBahrainBangladeshBelarusBelgiumBelizeBeninBermudaBhutanBoliviaBosnia and HerzegovinaBotswanaBrazilBrunei DarussalamBulgariaBurkina FasoBurundiCabo VerdeCambodiaCameroonCanadaCentral African RepublicChadChileChinaColombiaComorosCongo, Dem. Rep.Congo, Rep.Costa RicaCote d'IvoireCroatiaCubaCyprusCzech RepublicDenmarkDjiboutiDominicaDominican RepublicEcuadorEgypt, Arab Rep.El SalvadorEquatorial GuineaEritreaEstoniaEthiopiaFijiFinlandFranceGabonGambia, TheGeorgiaGermanyGhanaGreeceGrenadaGuatemalaGuineaGuinea-BissauGuyanaHaitiHondurasHong Kong SAR, ChinaHungaryIcelandIndiaIndonesiaIran, Islamic Rep.IraqIrelandItalyJamaicaJapanJordanKazakhstanKenyaKiribatiKorea, Rep.KosovoKuwaitKyrgyz RepublicLao PDRLatviaLebanonLesothoLiberiaLithuaniaLuxembourgMacedonia, FYRMadagascarMalawiMalaysiaMaldivesMaliMarshall IslandsMauritaniaMauritiusMexicoMicronesia, Fed. Sts.MoldovaMongoliaMontenegroMoroccoMozambiqueMyanmarNamibiaNepalNetherlandsNew ZealandNicaraguaNigerNigeriaNorwayOmanPakistanPalauPanamaPapua New GuineaParaguayPeruPhilippinesPolandPortugalPuerto RicoQatarRomaniaRussian FederationRwandaSamoaSao Tome and PrincipeSaudi ArabiaSenegalSerbiaSeychellesSierra LeoneSingaporeSlovak RepublicSloveniaSolomon IslandsSomaliaSouth AfricaSpainSri LankaSt. Kitts and NevisSt. LuciaSt. Vincent and the GrenadinesSudanSurinameSwazilandSwedenSwitzerlandSyrian Arab RepublicTajikistanTanzaniaThailandTimor-LesteTogoTongaTrinidad and TobagoTunisiaTurkeyTurkmenistanTuvaluUgandaUkraineUnited Arab EmiratesUnited KingdomUnited StatesUruguayUzbekistanVanuatuVenezuela, RBVietnamWest Bank and GazaZambiaZimbabwe línea de tiempo (timeline):
En esta escala de tiempo se presenta un gráfico de 1961 y 2016 de Philippines. Los datos de 1960 están ausentes. El número de observaciones reales por fecha: 56.
Fuente (nombre):
Indicadores del desarrollo mundial
Fuente (organización):
World Bank national accounts data, and OECD National Accounts data files.
Categorías:
Economy & Growth
Se ha actualizado:
23 abr 2017 año
Los indicadores de los cambios de valor en los últimos años
En promedio:
1.51 billones
Mínimo:
383.795 bn
1 ene 1961 año
Máximo:
4.338 billones
1 ene 2016 año
A la fecha de observación
Valor
Cambio absoluto
El cambio con respecto al valor anterior
1 ene 1961 año
383.795 bn
+383.795 bn
0.0%
1 ene 1962 año
404.543 bn
+20.748 bn
5.41%
1 ene 1963 año
426.276 bn
+21.733 bn
5.37%
1 ene 1964 año
449.375 bn
+23.099 bn
5.42%
1 ene 1965 año
467.309 bn
+17.934 bn
3.99%
1 ene 1966 año
487.87 bn
+20.561 bn
4.4%
1 ene 1967 año
508.582 bn
+20.713 bn
4.25%
1 ene 1968 año
531.929 bn
+23.346 bn
4.59%
1 ene 1969 año
556.805 bn
+24.877 bn
4.68%
1 ene 1970 año
584.21 bn
+27.404 bn
4.92%
1 ene 1971 año
606.237 bn
+22.027 bn
3.77%
1 ene 1972 año
634.601 bn
+28.365 bn
4.68%
1 ene 1973 año
661.615 bn
+27.013 bn
4.26%
1 ene 1974 año
703.111 bn
+41.496 bn
6.27%
1 ene 1975 año
729.472 bn
+26.362 bn
3.75%
1 ene 1976 año
763.49 bn
+34.018 bn
4.66%
1 ene 1977 año
813.03 bn
+49.539 bn
6.49%
1 ene 1978 año
849.44 bn
+36.41 bn
4.48%
1 ene 1979 año
894.972 bn
+45.532 bn
5.36%
1 ene 1980 año
940.348 bn
+45.377 bn
5.07%
1 ene 1981 año
994.356 bn
+54.007 bn
5.74%
1 ene 1982 año
1.016 billones
+21.989 bn
2.21%
1 ene 1983 año
1.075 billones
+58.544 bn
5.76%
1 ene 1984 año
1.119 billones
+43.68 bn
4.06%
1 ene 1985 año
1.055 billones
-63.357 bn
-5.66%
1 ene 1986 año
1.034 billones
-21.642 bn
-2.05%
1 ene 1987 año
1.076 billones
+42.75 bn
4.14%
1 ene 1988 año
1.129 billones
+52.793 bn
4.9%
1 ene 1989 año
1.203 billones
+73.76 bn
6.53%
1 ene 1990 año
1.28 billones
+77.088 bn
6.41%
1 ene 1991 año
1.334 billones
+53.757 bn
4.2%
1 ene 1992 año
1.338 billones
+4.349 bn
0.33%
1 ene 1993 año
1.351 billones
+12.443 bn
0.93%
1 ene 1994 año
1.383 billones
+32.874 bn
2.43%
1 ene 1995 año
1.439 billones
+55.289 bn
4.0%
1 ene 1996 año
1.502 billones
+63.644 bn
4.42%
1 ene 1997 año
1.593 billones
+90.474 bn
6.02%
1 ene 1998 año
1.674 billones
+81.302 bn
5.1%
1 ene 1999 año
1.71 billones
+36.259 bn
2.17%
1 ene 2000 año
1.788 billones
+77.375 bn
4.52%
1 ene 2001 año
1.847 billones
+59.102 bn
3.31%
1 ene 2002 año
1.921 billones
+74.543 bn
4.04%
1 ene 2003 año
2.003 billones
+81.151 bn
4.22%
1 ene 2004 año
2.113 billones
+110.045 bn
5.5%
1 ene 2005 año
2.287 billones
+174.405 bn
8.26%
1 ene 2006 año
2.419 billones
+132.306 bn
5.79%
1 ene 2007 año
2.565 billones
+145.679 bn
6.02%
1 ene 2008 año
2.759 billones
+194.416 bn
7.58%
1 ene 2009 año
2.869 billones
+110.004 bn
3.99%
1 ene 2010 año
2.967 billones
+97.516 bn
3.4%
1 ene 2011 año
3.179 billones
+212.463 bn
7.16%
1 ene 2012 año
3.336 billones
+157.057 bn
4.94%
1 ene 2013 año
3.575 billones
+238.391 bn
7.15%
1 ene 2014 año
3.825 billones
+249.799 bn
6.99%
1 ene 2015 año
4.06 billones
+235.842 bn
6.17%
1 ene 2016 año
4.338 billones
+277.837 bn
6.84%
Ranking de los países por los datos estadísticos actuales


Comentarios: