29
/es/
es
AIzaSyAYiBZKx7MnpbEhh9jyipgxe19OcubqV5w
April 1, 2024
133630
Finland
FIN
true
2
1
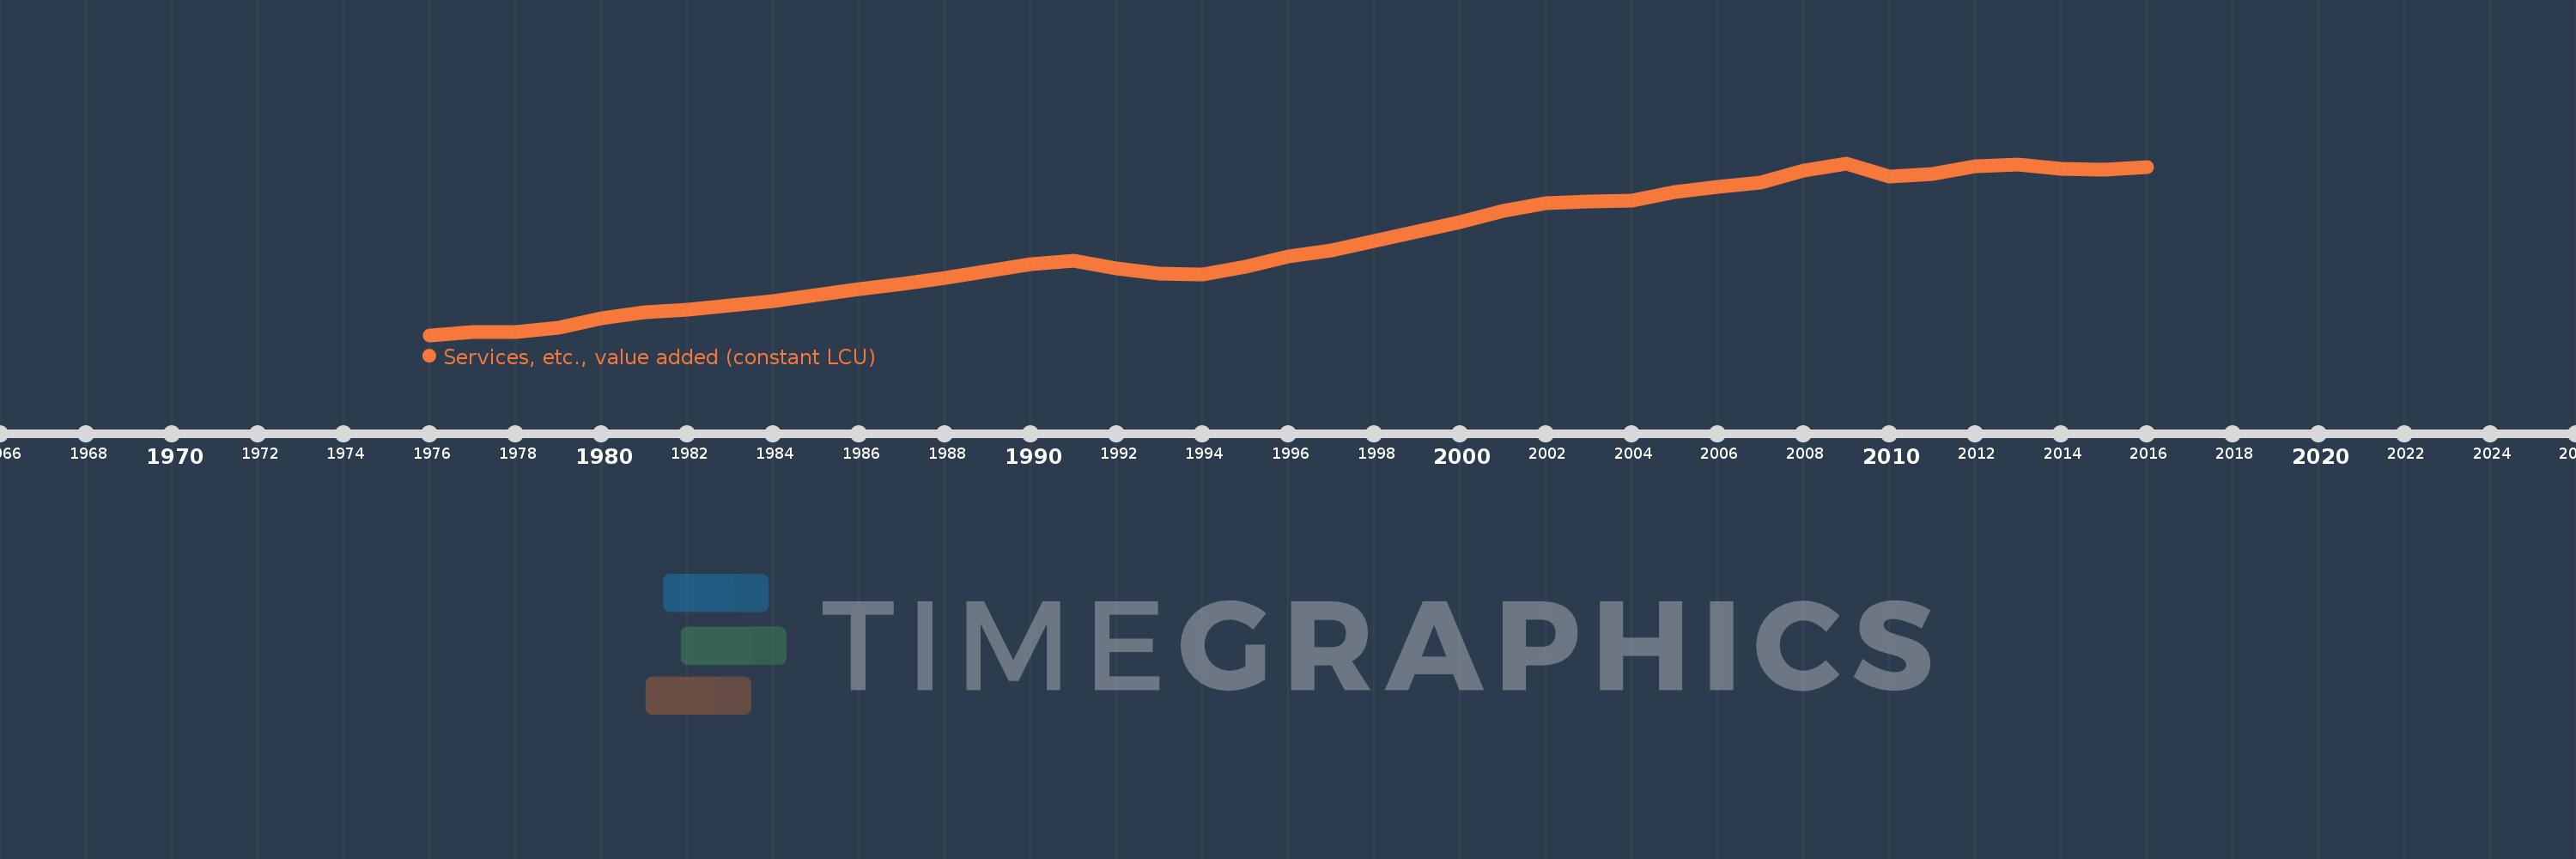
Services, etc., value added (constant LCU)
2016,2015,2014,2013,2012,2011,2010,2009,2008,2007,2006,2005,2004,2003,2002,2001,2000,1999,1998,1997,1996,1995,1994,1993,1992,1991,1990,1989,1988,1987,1986,1985,1984,1983,1982,1981,1980,1979,1978,1977,1976
Estas estadísticas en otros países:
AfghanistanAlbaniaAlgeriaAntigua and BarbudaArgentinaArmeniaAustraliaAustriaAzerbaijanBahamas, TheBahrainBangladeshBelarusBelgiumBelizeBeninBermudaBhutanBoliviaBosnia and HerzegovinaBotswanaBrazilBrunei DarussalamBulgariaBurkina FasoBurundiCabo VerdeCambodiaCameroonCanadaCentral African RepublicChadChileChinaColombiaComorosCongo, Dem. Rep.Congo, Rep.Costa RicaCote d'IvoireCroatiaCubaCyprusCzech RepublicDenmarkDjiboutiDominicaDominican RepublicEcuadorEgypt, Arab Rep.El SalvadorEquatorial GuineaEritreaEstoniaEthiopiaFijiFinlandFranceGabonGambia, TheGeorgiaGermanyGhanaGreeceGrenadaGuatemalaGuineaGuinea-BissauGuyanaHaitiHondurasHong Kong SAR, ChinaHungaryIcelandIndiaIndonesiaIran, Islamic Rep.IraqIrelandItalyJamaicaJapanJordanKazakhstanKenyaKiribatiKorea, Rep.KosovoKuwaitKyrgyz RepublicLao PDRLatviaLebanonLesothoLiberiaLithuaniaLuxembourgMacedonia, FYRMadagascarMalawiMalaysiaMaldivesMaliMarshall IslandsMauritaniaMauritiusMexicoMicronesia, Fed. Sts.MoldovaMongoliaMontenegroMoroccoMozambiqueMyanmarNamibiaNepalNetherlandsNew ZealandNicaraguaNigerNigeriaNorwayOmanPakistanPalauPanamaPapua New GuineaParaguayPeruPhilippinesPolandPortugalPuerto RicoQatarRomaniaRussian FederationRwandaSamoaSao Tome and PrincipeSaudi ArabiaSenegalSerbiaSeychellesSierra LeoneSingaporeSlovak RepublicSloveniaSolomon IslandsSomaliaSouth AfricaSpainSri LankaSt. Kitts and NevisSt. LuciaSt. Vincent and the GrenadinesSudanSurinameSwazilandSwedenSwitzerlandSyrian Arab RepublicTajikistanTanzaniaThailandTimor-LesteTogoTongaTrinidad and TobagoTunisiaTurkeyTurkmenistanTuvaluUgandaUkraineUnited Arab EmiratesUnited KingdomUnited StatesUruguayUzbekistanVanuatuVenezuela, RBVietnamWest Bank and GazaZambiaZimbabwe línea de tiempo (timeline):
En esta escala de tiempo se presenta un gráfico de 1976 y 2016 de Finland. Los datos de 1975 están ausentes. El número de observaciones reales por fecha: 41.
Fuente (nombre):
Indicadores del desarrollo mundial
Fuente (organización):
World Bank national accounts data, and OECD National Accounts data files.
Categorías:
Economy & Growth
Se ha actualizado:
23 abr 2017 año
Los indicadores de los cambios de valor en los últimos años
Mínimo:
43.903 bn
1 ene 1976 año
Máximo:
114.435 bn
1 ene 2009 año
A la fecha de observación
Valor
Cambio absoluto
El cambio con respecto al valor anterior
1 ene 1976 año
43.903 bn
+43.903 bn
0.0%
1 ene 1977 año
45.115 bn
+1.212 bn
2.76%
1 ene 1978 año
45.237 bn
+121.516 millones
0.27%
1 ene 1979 año
47.035 bn
+1.798 bn
3.97%
1 ene 1980 año
50.629 bn
+3.594 bn
7.64%
1 ene 1981 año
53.091 bn
+2.462 bn
4.86%
1 ene 1982 año
54.427 bn
+1.336 bn
2.52%
1 ene 1983 año
56.054 bn
+1.627 bn
2.99%
1 ene 1984 año
57.981 bn
+1.927 bn
3.44%
1 ene 1985 año
60.448 bn
+2.467 bn
4.25%
1 ene 1986 año
62.861 bn
+2.413 bn
3.99%
1 ene 1987 año
64.79 bn
+1.929 bn
3.07%
1 ene 1988 año
67.32 bn
+2.53 bn
3.9%
1 ene 1989 año
70.095 bn
+2.775 bn
4.12%
1 ene 1990 año
73.026 bn
+2.931 bn
4.18%
1 ene 1991 año
74.437 bn
+1.411 bn
1.93%
1 ene 1992 año
71.213 bn
-3.224 bn
-4.33%
1 ene 1993 año
68.967 bn
-2.246 bn
-3.15%
1 ene 1994 año
68.745 bn
-222.0 millones
-0.32%
1 ene 1995 año
71.987 bn
+3.242 bn
4.72%
1 ene 1996 año
76.099 bn
+4.112 bn
5.71%
1 ene 1997 año
78.649 bn
+2.55 bn
3.35%
1 ene 1998 año
82.401 bn
+3.752 bn
4.77%
1 ene 1999 año
86.421 bn
+4.02 bn
4.88%
1 ene 2000 año
90.38 bn
+3.959 bn
4.58%
1 ene 2001 año
94.698 bn
+4.318 bn
4.78%
1 ene 2002 año
98.068 bn
+3.37 bn
3.56%
1 ene 2003 año
98.787 bn
+719.0 millones
0.73%
1 ene 2004 año
99.226 bn
+439.0 millones
0.44%
1 ene 2005 año
102.681 bn
+3.455 bn
3.48%
1 ene 2006 año
104.753 bn
+2.072 bn
2.02%
1 ene 2007 año
106.467 bn
+1.714 bn
1.64%
1 ene 2008 año
111.449 bn
+4.982 bn
4.68%
1 ene 2009 año
114.435 bn
+2.986 bn
2.68%
1 ene 2010 año
108.833 bn
-5.602 bn
-4.9%
1 ene 2011 año
110.109 bn
+1.276 bn
1.17%
1 ene 2012 año
113.21 bn
+3.101 bn
2.82%
1 ene 2013 año
113.907 bn
+697.0 millones
0.62%
1 ene 2014 año
112.286 bn
-1.621 bn
-1.42%
1 ene 2015 año
111.723 bn
-563.0 millones
-0.5%
1 ene 2016 año
112.699 bn
+976.0 millones
0.87%
Ranking de los países por los datos estadísticos actuales


Comentarios: