29
/es/
es
AIzaSyAYiBZKx7MnpbEhh9jyipgxe19OcubqV5w
April 1, 2024
221991
Peru
PER
true
2
1
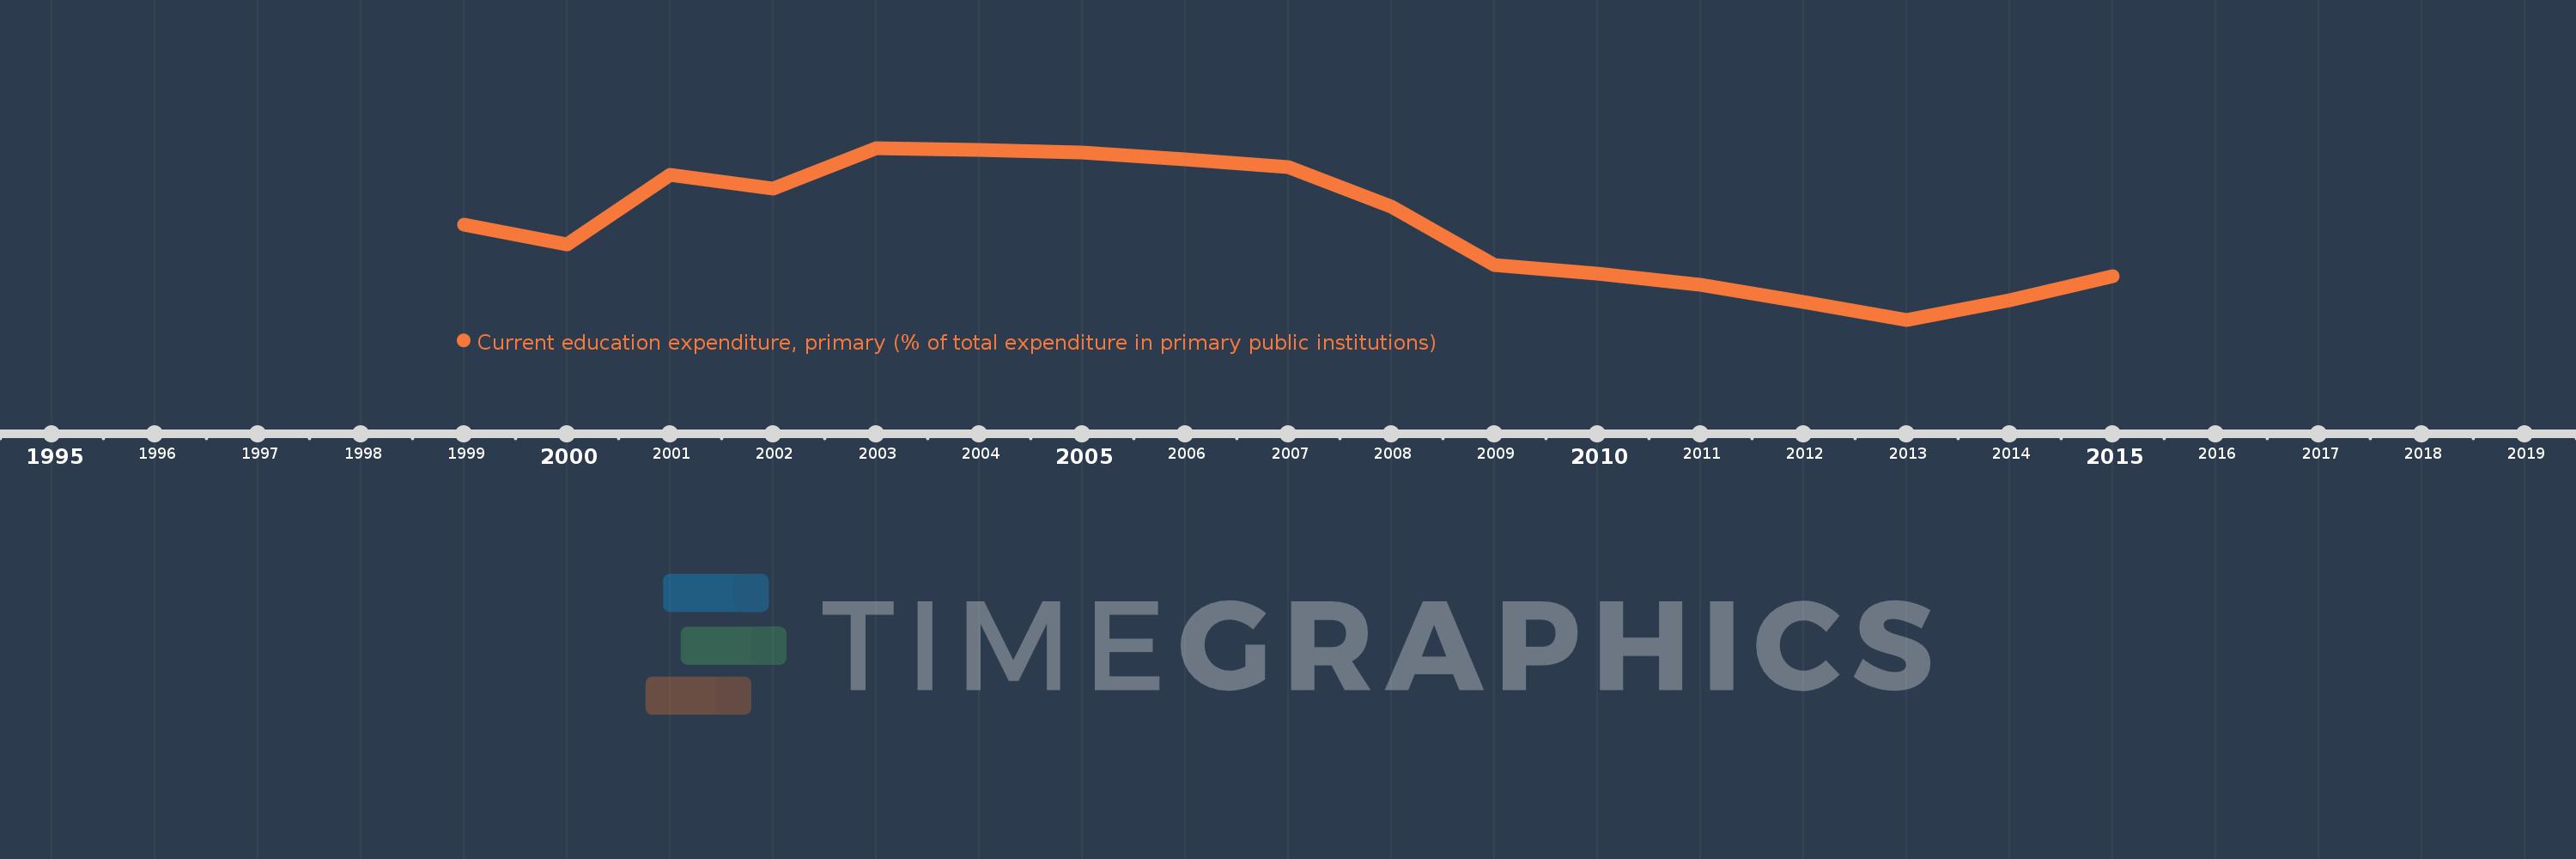
Current education expenditure, primary (% of total expenditure in primary public institutions)
2015,2014,2013,2012,2011,2010,2009,2008,2007,2006,2005,2004,2003,2002,2001,2000,1999
Estas estadísticas en otros países:
línea de tiempo (timeline):
En esta escala de tiempo se presenta un gráfico de 1999 y 2015 de Peru. Los datos de 1998 están ausentes. El número de observaciones reales por fecha: 17.
Fuente (nombre):
Indicadores del desarrollo mundial
Fuente (organización):
United Nations Educational, Scientific, and Cultural Organization (UNESCO) Institute for Statistics.
Categorías:
Education
Se ha actualizado:
23 abr 2017 año
Los indicadores de los cambios de valor en los últimos años
Mínimo:
75.772
1 ene 2013 año
Máximo:
99.28
1 ene 2003 año
A la fecha de observación
Valor
Cambio absoluto
El cambio con respecto al valor anterior
1 ene 1999 año
88.738
+88.738
0.0%
1 ene 2000 año
86.139
-2.599
-2.93%
1 ene 2001 año
95.609
+9.47
10.99%
1 ene 2002 año
93.724
-1.885
-1.97%
1 ene 2003 año
99.28
+5.556
5.93%
1 ene 2004 año
99.012
-0.268
-0.27%
1 ene 2005 año
98.638
-0.374
-0.38%
1 ene 2006 año
97.658
-0.98
-0.99%
1 ene 2007 año
96.61
-1.049
-1.07%
1 ene 2008 año
91.241
-5.369
-5.56%
1 ene 2009 año
83.301
-7.94
-8.7%
1 ene 2010 año
82.128
-1.173
-1.41%
1 ene 2011 año
80.589
-1.54
-1.87%
1 ene 2012 año
78.235
-2.353
-2.92%
1 ene 2013 año
75.772
-2.464
-3.15%
1 ene 2014 año
78.413
+2.641
3.49%
1 ene 2015 año
81.702
+3.289
4.19%
Ranking de los países por los datos estadísticos actuales


Comentarios: