29
/es/
es
AIzaSyAYiBZKx7MnpbEhh9jyipgxe19OcubqV5w
April 1, 2024
169749
Korea, Rep.
KOR
true
2
1
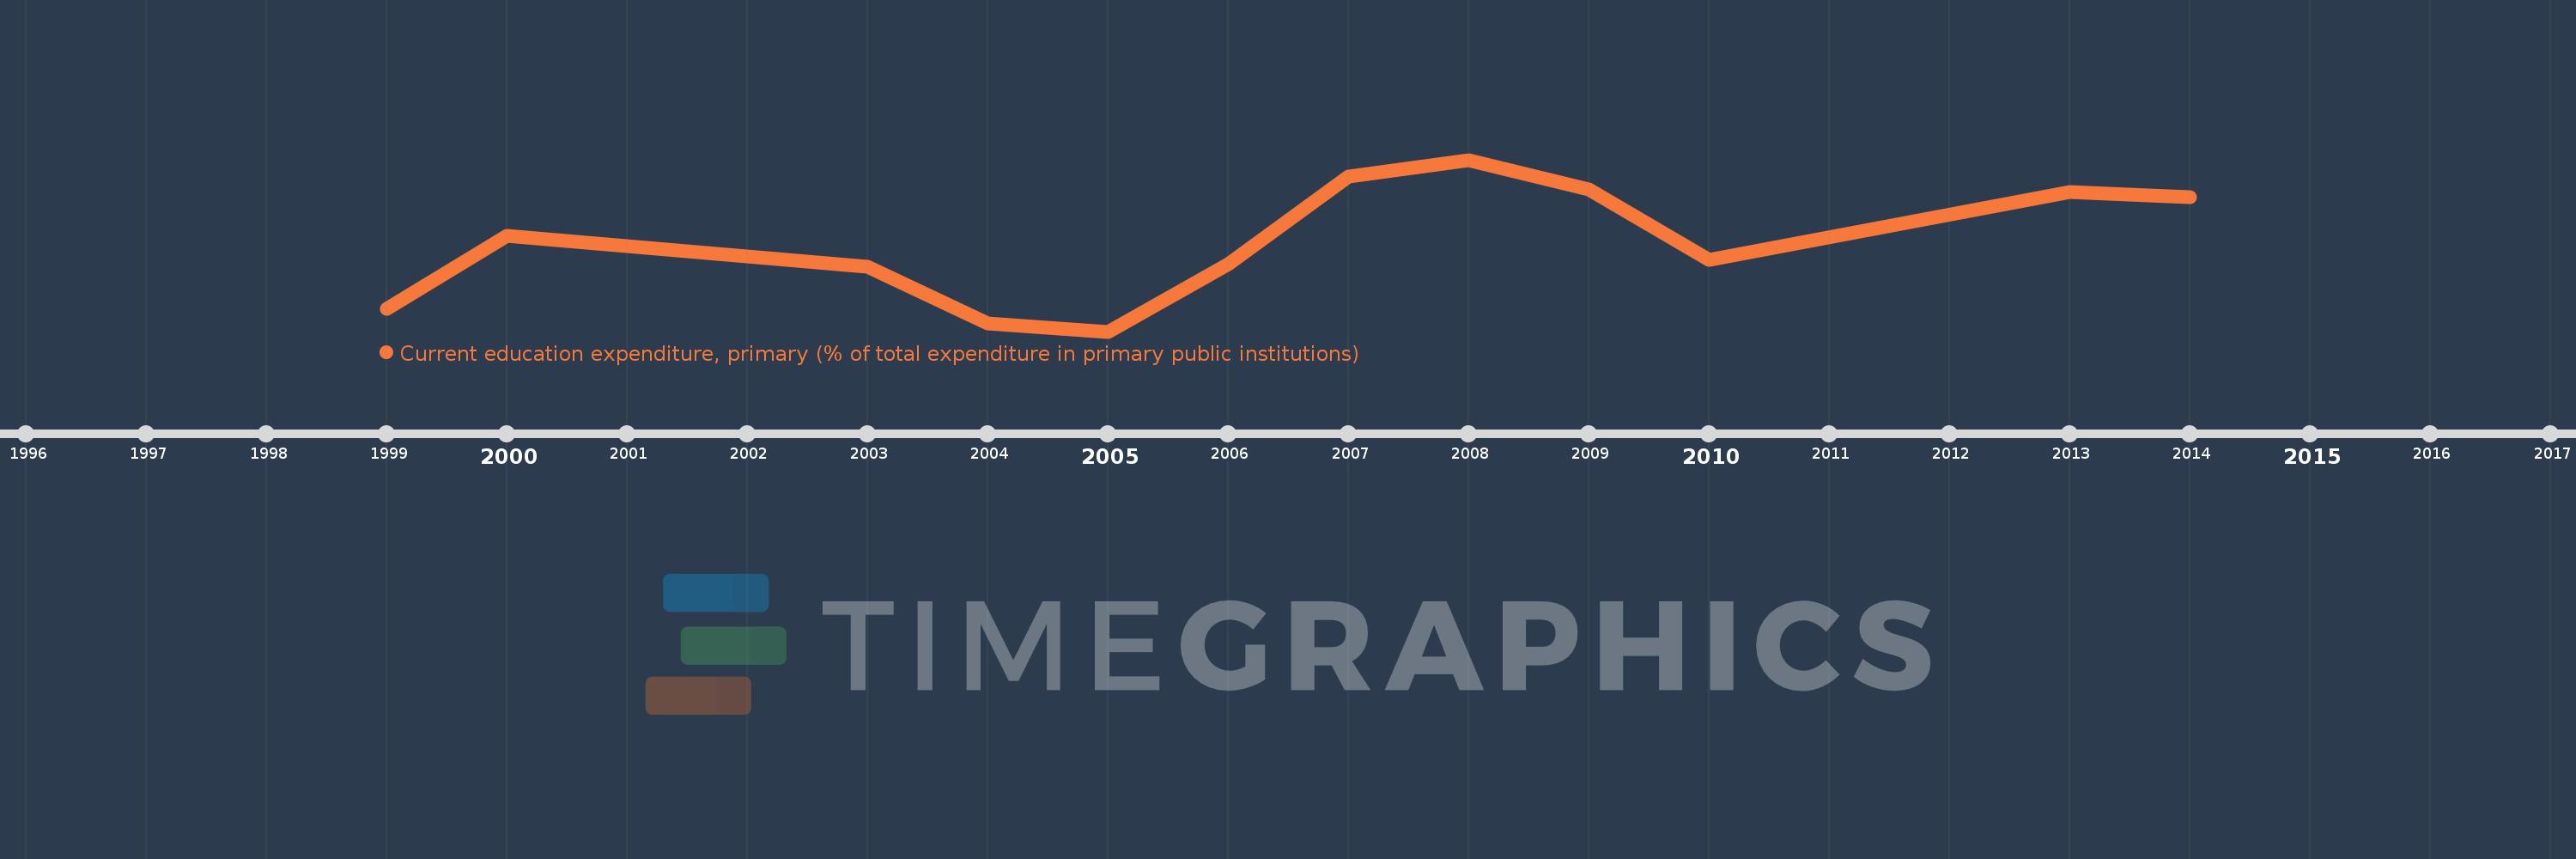
Current education expenditure, primary (% of total expenditure in primary public institutions)
2014,2013,2010,2009,2008,2007,2006,2005,2004,2003,2000,1999
Estas estadísticas en otros países:
línea de tiempo (timeline):
En esta escala de tiempo se presenta un gráfico de 1999 y 2014 de Korea, Rep.. Los datos de 1998 están ausentes. El número de observaciones reales por fecha: 12.
Fuente (nombre):
Indicadores del desarrollo mundial
Fuente (organización):
United Nations Educational, Scientific, and Cultural Organization (UNESCO) Institute for Statistics.
Categorías:
Education
Se ha actualizado:
23 abr 2017 año
Los indicadores de los cambios de valor en los últimos años
Mínimo:
78.434
1 ene 2005 año
Máximo:
89.36
1 ene 2008 año
A la fecha de observación
Valor
Cambio absoluto
El cambio con respecto al valor anterior
1 ene 1999 año
79.879
+79.879
0.0%
1 ene 2000 año
84.548
+4.669
5.85%
1 ene 2003 año
82.583
-1.965
-2.32%
1 ene 2004 año
78.961
-3.622
-4.39%
1 ene 2005 año
78.434
-0.527
-0.67%
1 ene 2006 año
82.735
+4.301
5.48%
1 ene 2007 año
88.303
+5.568
6.73%
1 ene 2008 año
89.36
+1.057
1.2%
1 ene 2009 año
87.485
-1.874
-2.1%
1 ene 2010 año
83.002
-4.483
-5.12%
1 ene 2013 año
87.31
+4.307
5.19%
1 ene 2014 año
86.98
-0.329
-0.38%
Ranking de los países por los datos estadísticos actuales


Comentarios: