29
/es/
es
AIzaSyAYiBZKx7MnpbEhh9jyipgxe19OcubqV5w
April 1, 2024
221774
Peru
PER
true
2
1
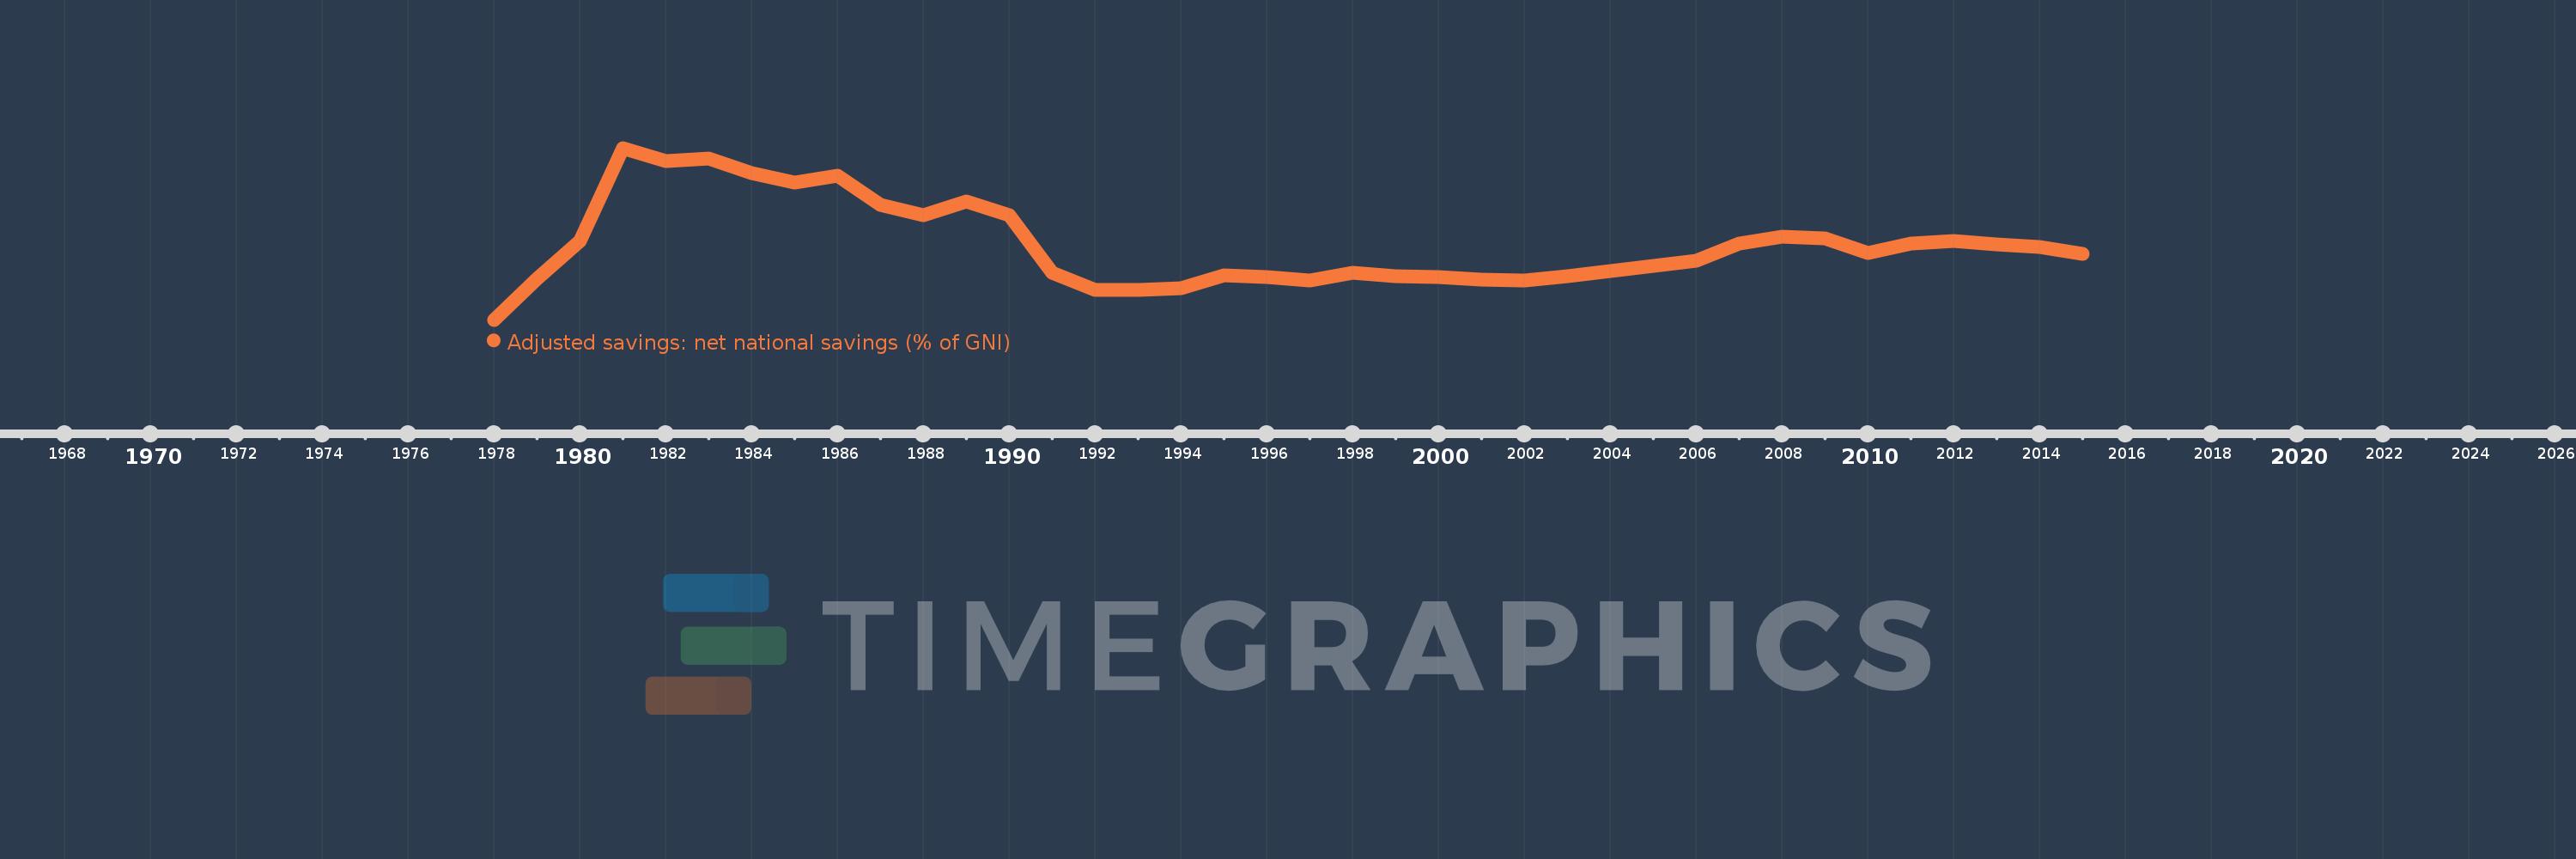
Adjusted savings: net national savings (% of GNI)
2015,2014,2013,2012,2011,2010,2009,2008,2007,2006,2005,2004,2003,2002,2001,2000,1999,1998,1997,1996,1995,1994,1993,1992,1991,1990,1989,1988,1987,1986,1985,1984,1983,1982,1981,1980,1979,1978
Estas estadísticas en otros países:
AfghanistanAlbaniaAlgeriaAngolaAntigua and BarbudaArab WorldArgentinaArmeniaAustraliaAustriaAzerbaijanBahamas, TheBahrainBangladeshBarbadosBelarusBelgiumBelizeBeninBermudaBhutanBoliviaBosnia and HerzegovinaBotswanaBrazilBrunei DarussalamBulgariaBurkina FasoBurundiCabo VerdeCambodiaCameroonCanadaCaribbean small statesCentral African RepublicCentral Europe and the BalticsChadChileChinaColombiaComorosCongo, Dem. Rep.Congo, Rep.Costa RicaCote d'IvoireCroatiaCyprusCzech RepublicDenmarkDjiboutiDominicaDominican RepublicEarly-demographic dividendEast Asia & PacificEast Asia & Pacific (excluding high income)East Asia & Pacific (IDA & IBRD countries)EcuadorEgypt, Arab Rep.El SalvadorEquatorial GuineaEritreaEstoniaEthiopiaEuro areaEurope & Central AsiaEurope & Central Asia (excluding high income)Europe & Central Asia (IDA & IBRD countries)European UnionFijiFinlandFragile and conflict affected situationsFranceGabonGambia, TheGeorgiaGermanyGhanaGreeceGrenadaGuatemalaGuineaGuinea-BissauGuyanaHaitiHeavily indebted poor countries (HIPC)High incomeHondurasHong Kong SAR, ChinaHungaryIBRD onlyIcelandIDA & IBRD totalIDA blendIDA onlyIDA totalIndiaIndonesiaIran, Islamic Rep.IraqIrelandIsraelItalyJamaicaJapanJordanKazakhstanKenyaKiribatiKorea, Rep.KosovoKuwaitKyrgyz RepublicLao PDRLate-demographic dividendLatin America & Caribbean Latin America & Caribbean (excluding high income)Latin America & the Caribbean (IDA & IBRD countries)LatviaLeast developed countries: UN classificationLebanonLesothoLiberiaLibyaLithuaniaLow & middle incomeLow incomeLower middle incomeLuxembourgMacao SAR, ChinaMacedonia, FYRMadagascarMalawiMalaysiaMaldivesMaliMaltaMauritaniaMauritiusMexicoMiddle East & North AfricaMiddle East & North Africa (excluding high income)Middle East & North Africa (IDA & IBRD countries)Middle incomeMoldovaMongoliaMontenegroMoroccoMozambiqueNamibiaNepalNetherlandsNew ZealandNicaraguaNigerNigeriaNorth AmericaNorwayOECD membersOmanOther small statesPacific island small statesPakistanPanamaPapua New GuineaParaguayPeruPhilippinesPolandPortugalPost-demographic dividendPre-demographic dividendQatarRomaniaRussian FederationRwandaSaudi ArabiaSenegalSerbiaSeychellesSierra LeoneSingaporeSlovak RepublicSloveniaSmall statesSolomon IslandsSouth AfricaSouth AsiaSouth Asia (IDA & IBRD)SpainSri LankaSt. Kitts and NevisSt. LuciaSt. Vincent and the GrenadinesSub-Saharan Africa Sub-Saharan Africa (excluding high income)Sub-Saharan Africa (IDA & IBRD countries)SudanSurinameSwazilandSwedenSwitzerlandSyrian Arab RepublicTajikistanTanzaniaThailandTimor-LesteTogoTongaTrinidad and TobagoTunisiaTurkeyTurkmenistanUgandaUkraineUnited KingdomUnited StatesUpper middle incomeUruguayVanuatuVenezuela, RBVietnamWest Bank and GazaWorldYemen, Rep.ZambiaZimbabwe línea de tiempo (timeline):
En esta escala de tiempo se presenta un gráfico de 1978 y 2015 de Peru. Los datos de 1977 están ausentes. El número de observaciones reales por fecha: 38.
Fuente (nombre):
Indicadores del desarrollo mundial
Fuente (organización):
World Bank staff estimates based on sources and methods in World Bank's "The Changing Wealth of Nations: Measuring Sustainable Development in the New Millennium" (2011).
Categorías:
Economy & Growth, Environment
Se ha actualizado:
23 abr 2017 año
Los indicadores de los cambios de valor en los últimos años
Mínimo:
-5.742
1 ene 1978 año
Máximo:
48.984
1 ene 1981 año
A la fecha de observación
Valor
Cambio absoluto
El cambio con respecto al valor anterior
1 ene 1978 año
-5.742
-5.742
0.0%
1 ene 1979 año
7.279
+13.021
-226.78%
1 ene 1980 año
19.251
+11.971
164.46%
1 ene 1981 año
48.984
+29.733
154.45%
1 ene 1982 año
44.766
-4.218
-8.61%
1 ene 1983 año
45.491
+0.724
1.62%
1 ene 1984 año
41.022
-4.469
-9.82%
1 ene 1985 año
37.955
-3.067
-7.48%
1 ene 1986 año
40.094
+2.139
5.64%
1 ene 1987 año
30.852
-9.242
-23.05%
1 ene 1988 año
27.502
-3.35
-10.86%
1 ene 1989 año
31.925
+4.423
16.08%
1 ene 1990 año
27.443
-4.482
-14.04%
1 ene 1991 año
9.231
-18.212
-66.36%
1 ene 1992 año
3.824
-5.407
-58.57%
1 ene 1993 año
3.866
+0.042
1.09%
1 ene 1994 año
4.328
+0.462
11.96%
1 ene 1995 año
8.535
+4.206
97.18%
1 ene 1996 año
7.932
-0.602
-7.06%
1 ene 1997 año
6.896
-1.037
-13.07%
1 ene 1998 año
9.361
+2.465
35.75%
1 ene 1999 año
8.1
-1.261
-13.47%
1 ene 2000 año
7.739
-0.361
-4.46%
1 ene 2001 año
6.922
-0.817
-10.56%
1 ene 2002 año
6.705
-0.217
-3.13%
1 ene 2003 año
8.029
+1.324
19.75%
1 ene 2004 año
9.806
+1.776
22.12%
1 ene 2005 año
11.425
+1.62
16.52%
1 ene 2006 año
13.135
+1.709
14.96%
1 ene 2007 año
18.641
+5.507
41.93%
1 ene 2008 año
20.757
+2.116
11.35%
1 ene 2009 año
20.118
-0.639
-3.08%
1 ene 2010 año
15.421
-4.697
-23.34%
1 ene 2011 año
18.612
+3.19
20.69%
1 ene 2012 año
19.421
+0.81
4.35%
1 ene 2013 año
18.157
-1.265
-6.51%
1 ene 2014 año
17.509
-0.648
-3.57%
1 ene 2015 año
15.368
-2.141
-12.23%
Ranking de los países por los datos estadísticos actuales


Comentarios: