29
/es/
es
AIzaSyAYiBZKx7MnpbEhh9jyipgxe19OcubqV5w
April 1, 2024
177296
Lesotho
LSO
true
2
1
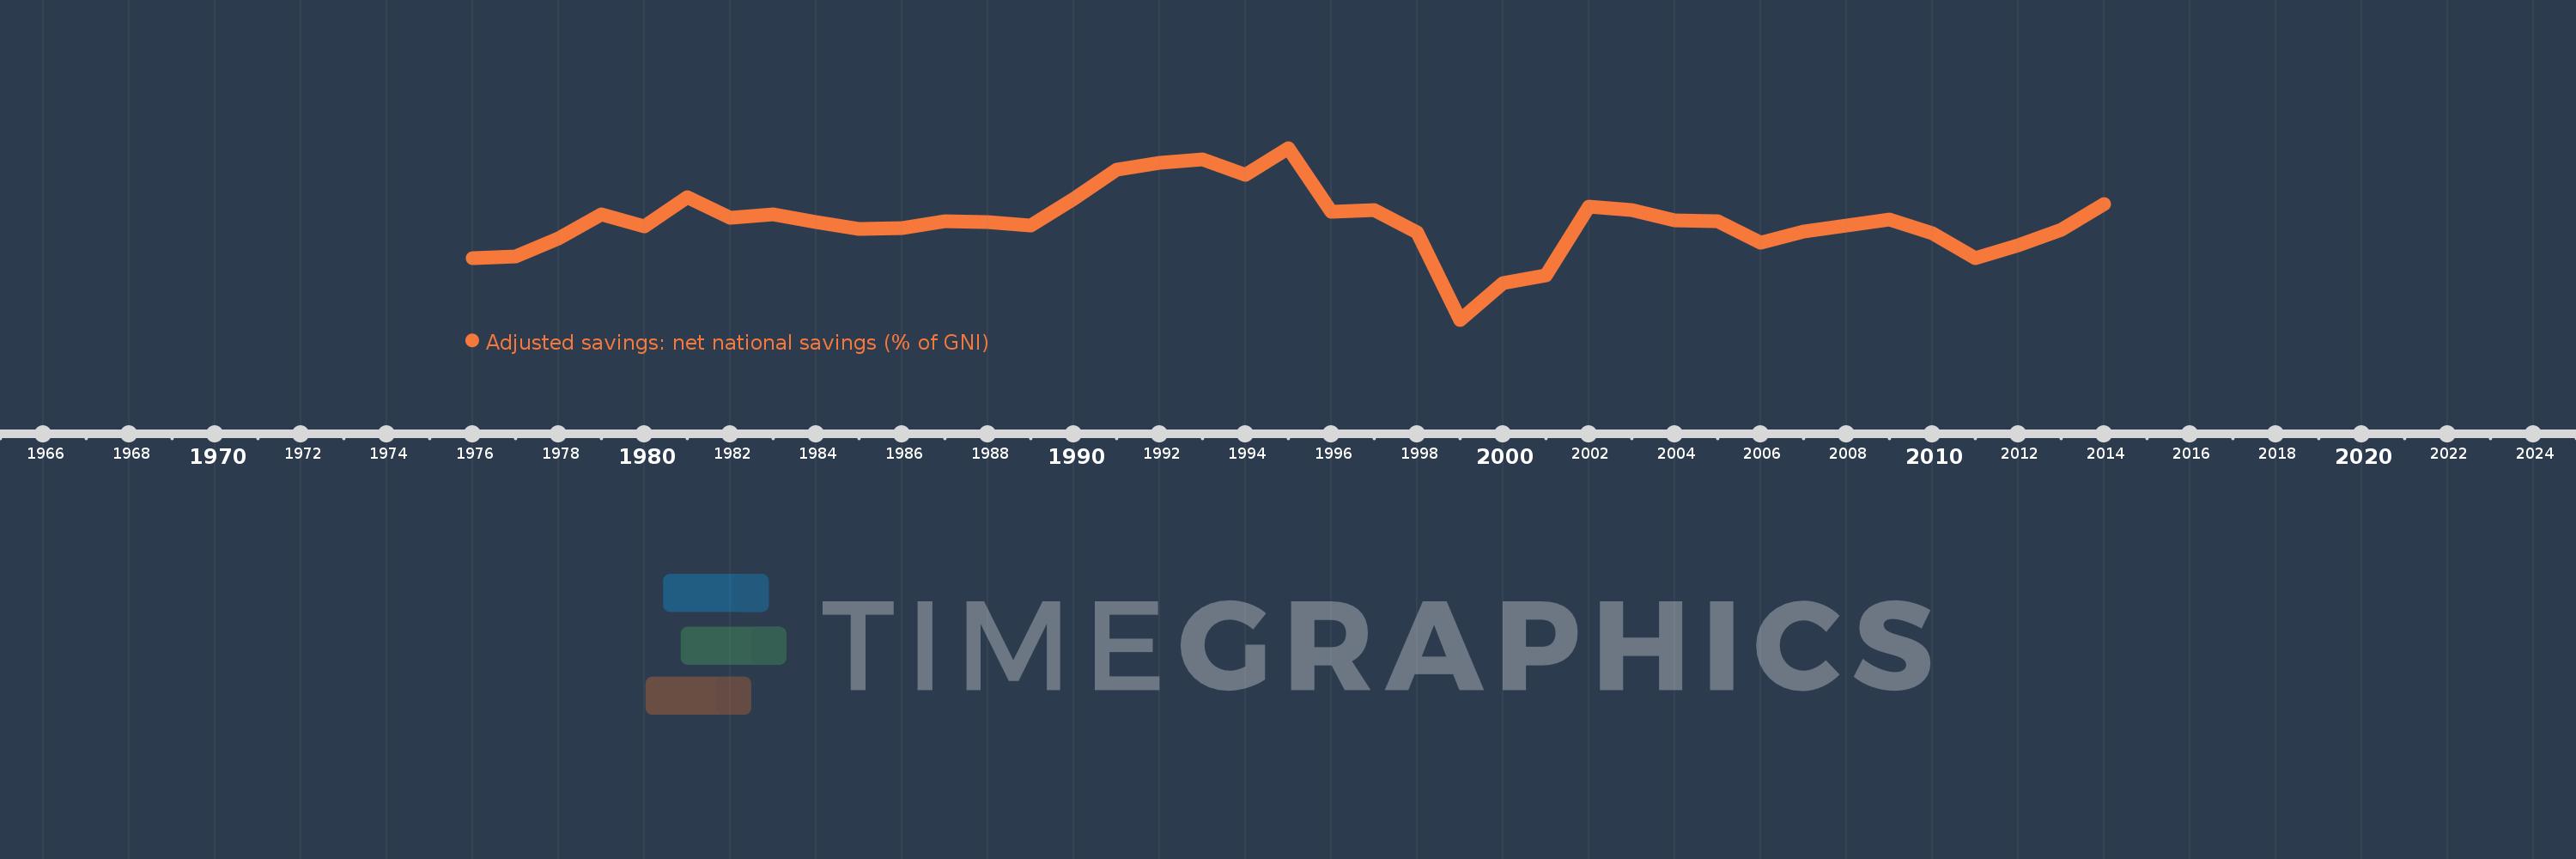
Adjusted savings: net national savings (% of GNI)
2014,2013,2012,2011,2010,2009,2008,2007,2006,2005,2004,2003,2002,2001,2000,1999,1998,1997,1996,1995,1994,1993,1992,1991,1990,1989,1988,1987,1986,1985,1984,1983,1982,1981,1980,1979,1978,1977,1976
Estas estadísticas en otros países:
AfghanistanAlbaniaAlgeriaAngolaAntigua and BarbudaArab WorldArgentinaArmeniaAustraliaAustriaAzerbaijanBahamas, TheBahrainBangladeshBarbadosBelarusBelgiumBelizeBeninBermudaBhutanBoliviaBosnia and HerzegovinaBotswanaBrazilBrunei DarussalamBulgariaBurkina FasoBurundiCabo VerdeCambodiaCameroonCanadaCaribbean small statesCentral African RepublicCentral Europe and the BalticsChadChileChinaColombiaComorosCongo, Dem. Rep.Congo, Rep.Costa RicaCote d'IvoireCroatiaCyprusCzech RepublicDenmarkDjiboutiDominicaDominican RepublicEarly-demographic dividendEast Asia & PacificEast Asia & Pacific (excluding high income)East Asia & Pacific (IDA & IBRD countries)EcuadorEgypt, Arab Rep.El SalvadorEquatorial GuineaEritreaEstoniaEthiopiaEuro areaEurope & Central AsiaEurope & Central Asia (excluding high income)Europe & Central Asia (IDA & IBRD countries)European UnionFijiFinlandFragile and conflict affected situationsFranceGabonGambia, TheGeorgiaGermanyGhanaGreeceGrenadaGuatemalaGuineaGuinea-BissauGuyanaHaitiHeavily indebted poor countries (HIPC)High incomeHondurasHong Kong SAR, ChinaHungaryIBRD onlyIcelandIDA & IBRD totalIDA blendIDA onlyIDA totalIndiaIndonesiaIran, Islamic Rep.IraqIrelandIsraelItalyJamaicaJapanJordanKazakhstanKenyaKiribatiKorea, Rep.KosovoKuwaitKyrgyz RepublicLao PDRLate-demographic dividendLatin America & Caribbean Latin America & Caribbean (excluding high income)Latin America & the Caribbean (IDA & IBRD countries)LatviaLeast developed countries: UN classificationLebanonLesothoLiberiaLibyaLithuaniaLow & middle incomeLow incomeLower middle incomeLuxembourgMacao SAR, ChinaMacedonia, FYRMadagascarMalawiMalaysiaMaldivesMaliMaltaMauritaniaMauritiusMexicoMiddle East & North AfricaMiddle East & North Africa (excluding high income)Middle East & North Africa (IDA & IBRD countries)Middle incomeMoldovaMongoliaMontenegroMoroccoMozambiqueNamibiaNepalNetherlandsNew ZealandNicaraguaNigerNigeriaNorth AmericaNorwayOECD membersOmanOther small statesPacific island small statesPakistanPanamaPapua New GuineaParaguayPeruPhilippinesPolandPortugalPost-demographic dividendPre-demographic dividendQatarRomaniaRussian FederationRwandaSaudi ArabiaSenegalSerbiaSeychellesSierra LeoneSingaporeSlovak RepublicSloveniaSmall statesSolomon IslandsSouth AfricaSouth AsiaSouth Asia (IDA & IBRD)SpainSri LankaSt. Kitts and NevisSt. LuciaSt. Vincent and the GrenadinesSub-Saharan Africa Sub-Saharan Africa (excluding high income)Sub-Saharan Africa (IDA & IBRD countries)SudanSurinameSwazilandSwedenSwitzerlandSyrian Arab RepublicTajikistanTanzaniaThailandTimor-LesteTogoTongaTrinidad and TobagoTunisiaTurkeyTurkmenistanUgandaUkraineUnited KingdomUnited StatesUpper middle incomeUruguayVanuatuVenezuela, RBVietnamWest Bank and GazaWorldYemen, Rep.ZambiaZimbabwe línea de tiempo (timeline):
En esta escala de tiempo se presenta un gráfico de 1976 y 2014 de Lesotho. Los datos de 1975 están ausentes. El número de observaciones reales por fecha: 39.
Fuente (nombre):
Indicadores del desarrollo mundial
Fuente (organización):
World Bank staff estimates based on sources and methods in World Bank's "The Changing Wealth of Nations: Measuring Sustainable Development in the New Millennium" (2011).
Categorías:
Economy & Growth, Environment
Se ha actualizado:
23 abr 2017 año
Los indicadores de los cambios de valor en los últimos años
Mínimo:
-19.242
1 ene 1999 año
Máximo:
47.344
1 ene 1995 año
A la fecha de observación
Valor
Cambio absoluto
El cambio con respecto al valor anterior
1 ene 1976 año
4.732
+4.732
0.0%
1 ene 1977 año
5.228
+0.495
10.47%
1 ene 1978 año
12.344
+7.116
136.12%
1 ene 1979 año
21.617
+9.273
75.12%
1 ene 1980 año
16.904
-4.713
-21.8%
1 ene 1981 año
28.28
+11.376
67.3%
1 ene 1982 año
20.114
-8.166
-28.88%
1 ene 1983 año
21.774
+1.66
8.26%
1 ene 1984 año
18.749
-3.025
-13.89%
1 ene 1985 año
16.095
-2.655
-14.16%
1 ene 1986 año
16.213
+0.118
0.73%
1 ene 1987 año
18.861
+2.649
16.34%
1 ene 1988 año
18.654
-0.207
-1.1%
1 ene 1989 año
17.159
-1.495
-8.01%
1 ene 1990 año
27.469
+10.309
60.08%
1 ene 1991 año
38.905
+11.437
41.64%
1 ene 1992 año
41.621
+2.716
6.98%
1 ene 1993 año
42.998
+1.376
3.31%
1 ene 1994 año
36.846
-6.152
-14.31%
1 ene 1995 año
47.344
+10.499
28.49%
1 ene 1996 año
22.607
-24.737
-52.25%
1 ene 1997 año
23.137
+0.53
2.35%
1 ene 1998 año
14.479
-8.658
-37.42%
1 ene 1999 año
-19.242
-33.721
-232.9%
1 ene 2000 año
-5.146
+14.096
-73.25%
1 ene 2001 año
-2.082
+3.065
-59.55%
1 ene 2002 año
24.757
+26.839
-1.29 mil%
1 ene 2003 año
23.34
-1.417
-5.72%
1 ene 2004 año
19.391
-3.949
-16.92%
1 ene 2005 año
18.799
-0.593
-3.06%
1 ene 2006 año
10.51
-8.289
-44.09%
1 ene 2007 año
15.103
+4.594
43.71%
1 ene 2008 año
17.439
+2.336
15.46%
1 ene 2009 año
19.591
+2.152
12.34%
1 ene 2010 año
14.186
-5.405
-27.59%
1 ene 2011 año
4.481
-9.705
-68.42%
1 ene 2012 año
9.77
+5.29
118.06%
1 ene 2013 año
15.759
+5.988
61.29%
1 ene 2014 año
25.681
+9.922
62.96%
Ranking de los países por los datos estadísticos actuales


Comentarios: