29
/es/
es
AIzaSyAYiBZKx7MnpbEhh9jyipgxe19OcubqV5w
April 1, 2024
220990
Paraguay
PRY
true
2
1
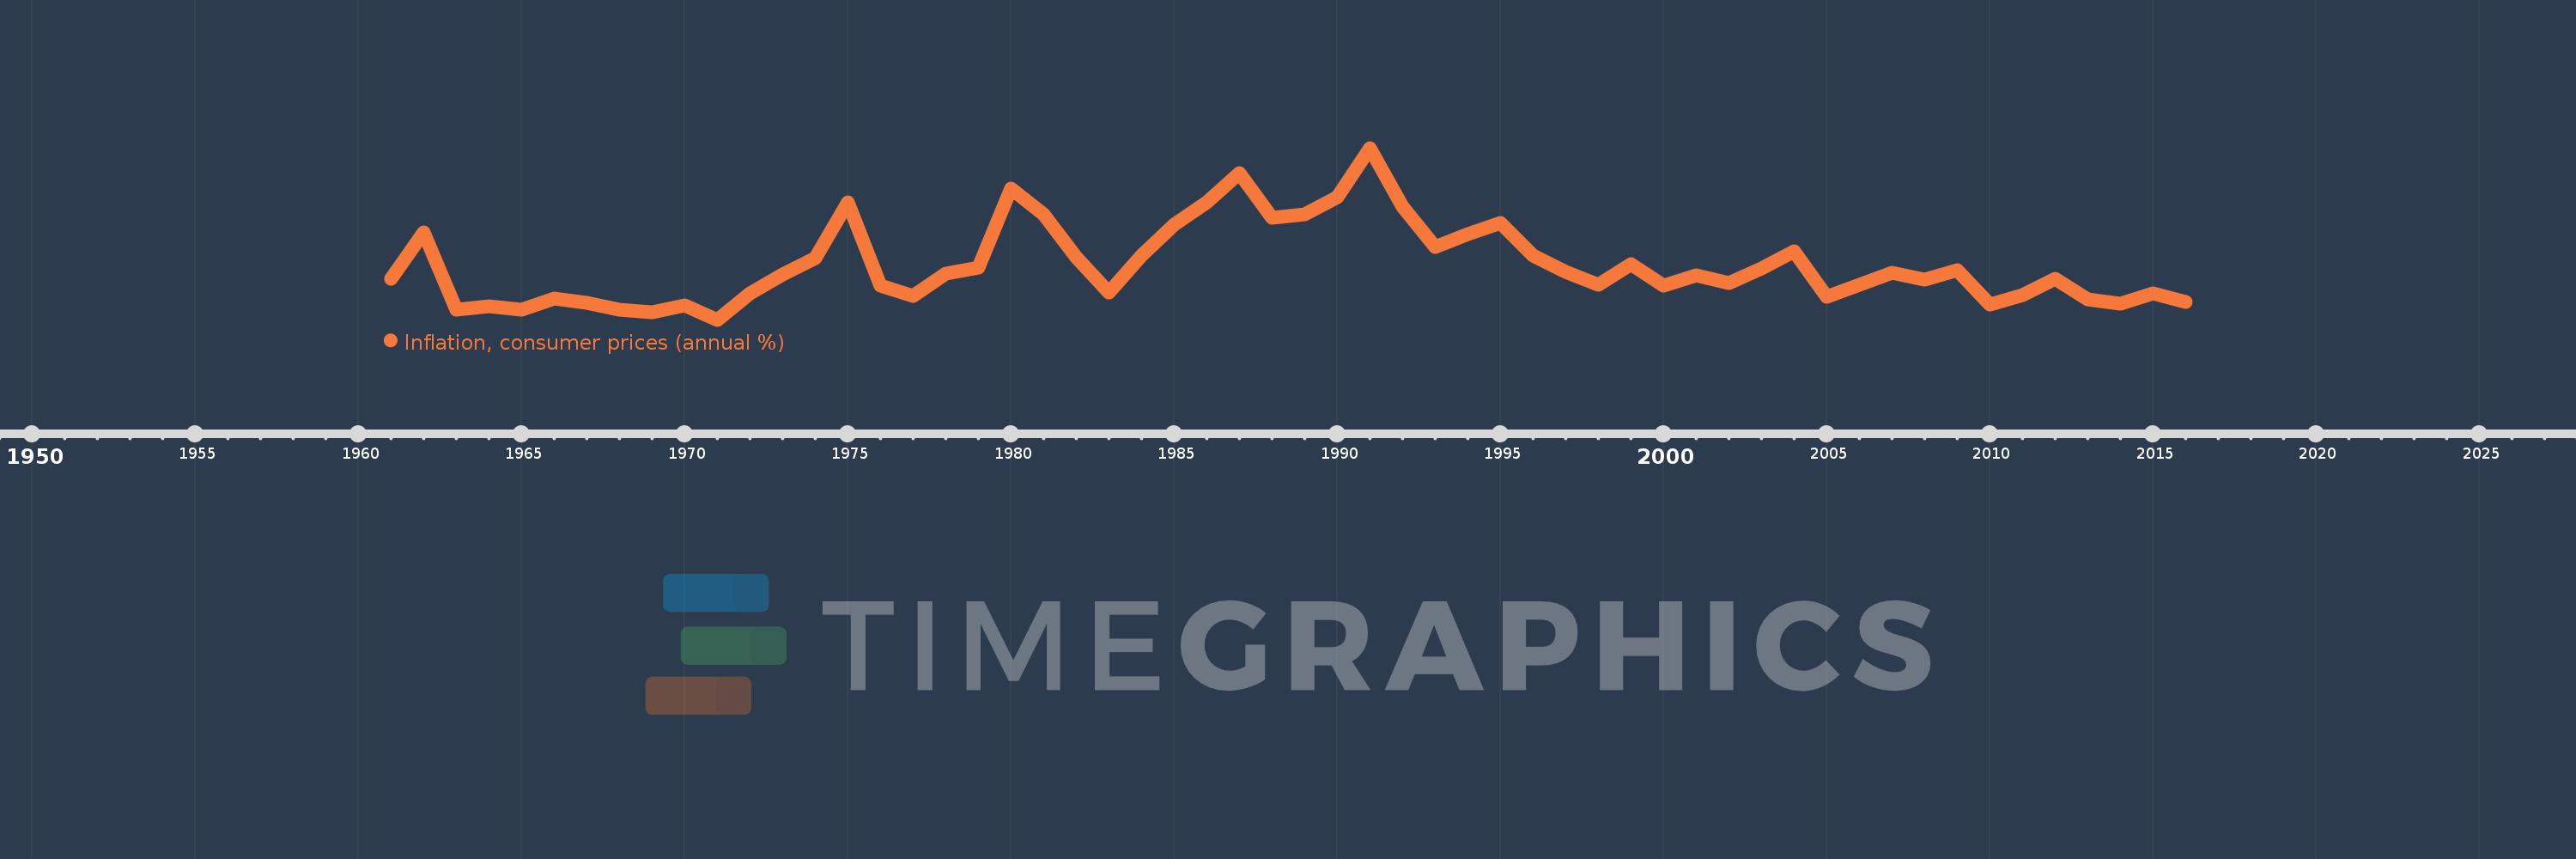
Inflation, consumer prices (annual %)
2016,2015,2014,2013,2012,2011,2010,2009,2008,2007,2006,2005,2004,2003,2002,2001,2000,1999,1998,1997,1996,1995,1994,1993,1992,1991,1990,1989,1988,1987,1986,1985,1984,1983,1982,1981,1980,1979,1978,1977,1976,1975,1974,1973,1972,1971,1970,1969,1968,1967,1966,1965,1964,1963,1962,1961
Estas estadísticas en otros países:
AfghanistanAlbaniaAlgeriaAngolaAntigua and BarbudaArab WorldArgentinaArmeniaArubaAustraliaAustriaAzerbaijanBahamas, TheBahrainBangladeshBarbadosBelarusBelgiumBelizeBeninBhutanBoliviaBotswanaBrazilBrunei DarussalamBulgariaBurkina FasoBurundiCabo VerdeCambodiaCameroonCanadaCaribbean small statesCentral African RepublicCentral Europe and the BalticsChadChileChinaColombiaComorosCongo, Dem. Rep.Congo, Rep.Costa RicaCote d'IvoireCroatiaCyprusCzech RepublicDenmarkDjiboutiDominicaDominican RepublicEarly-demographic dividendEast Asia & PacificEast Asia & Pacific (excluding high income)East Asia & Pacific (IDA & IBRD countries)EcuadorEgypt, Arab Rep.El SalvadorEquatorial GuineaEstoniaEthiopiaEuro areaEurope & Central AsiaEurope & Central Asia (excluding high income)Europe & Central Asia (IDA & IBRD countries)European UnionFijiFinlandFragile and conflict affected situationsFranceGabonGambia, TheGeorgiaGermanyGhanaGreeceGrenadaGuatemalaGuineaGuinea-BissauGuyanaHaitiHeavily indebted poor countries (HIPC)High incomeHondurasHong Kong SAR, ChinaHungaryIBRD onlyIcelandIDA & IBRD totalIDA blendIDA onlyIDA totalIndiaIndonesiaIran, Islamic Rep.IraqIrelandIsraelItalyJamaicaJapanJordanKazakhstanKenyaKorea, Rep.KuwaitKyrgyz RepublicLao PDRLate-demographic dividendLatin America & Caribbean Latin America & Caribbean (excluding high income)Latin America & the Caribbean (IDA & IBRD countries)LatviaLeast developed countries: UN classificationLebanonLesothoLiberiaLibyaLithuaniaLow & middle incomeLow incomeLower middle incomeLuxembourgMacao SAR, ChinaMacedonia, FYRMadagascarMalawiMalaysiaMaldivesMaliMaltaMauritaniaMauritiusMexicoMiddle East & North AfricaMiddle East & North Africa (excluding high income)Middle East & North Africa (IDA & IBRD countries)Middle incomeMoldovaMongoliaMontenegroMoroccoMozambiqueMyanmarNamibiaNepalNetherlandsNew ZealandNicaraguaNigerNigeriaNorth AmericaNorwayOECD membersOmanOther small statesPakistanPanamaPapua New GuineaParaguayPeruPhilippinesPolandPortugalPost-demographic dividendPre-demographic dividendQatarRomaniaRussian FederationRwandaSamoaSao Tome and PrincipeSaudi ArabiaSenegalSerbiaSeychellesSierra LeoneSingaporeSlovak RepublicSloveniaSmall statesSolomon IslandsSouth AfricaSouth AsiaSouth Asia (IDA & IBRD)South SudanSpainSri LankaSt. Kitts and NevisSt. LuciaSt. Vincent and the GrenadinesSub-Saharan Africa Sub-Saharan Africa (excluding high income)Sub-Saharan Africa (IDA & IBRD countries)SudanSurinameSwazilandSwedenSwitzerlandSyrian Arab RepublicTajikistanTanzaniaThailandTimor-LesteTogoTongaTrinidad and TobagoTunisiaTurkeyUgandaUkraineUnited KingdomUnited StatesUpper middle incomeUruguayVanuatuVenezuela, RBVietnamWorldYemen, Rep.ZambiaZimbabwe línea de tiempo (timeline):
En esta escala de tiempo se presenta un gráfico de 1961 y 2016 de Paraguay. Los datos de 1960 están ausentes. El número de observaciones reales por fecha: 56.
Fuente (nombre):
Indicadores del desarrollo mundial
Fuente (organización):
International Monetary Fund, International Financial Statistics and data files.
Categorías:
Economy & Growth, Financial Sector
Se ha actualizado:
23 abr 2017 año
Los indicadores de los cambios de valor en los últimos años
Mínimo:
-0.86
1 ene 1971 año
Máximo:
37.26
1 ene 1991 año
A la fecha de observación
Valor
Cambio absoluto
El cambio con respecto al valor anterior
1 ene 1961 año
8.182
+8.182
0.0%
1 ene 1962 año
18.487
+10.306
125.96%
1 ene 1963 año
1.418
-17.069
-92.33%
1 ene 1964 año
2.098
+0.679
47.9%
1 ene 1965 año
1.37
-0.728
-34.7%
1 ene 1966 año
3.859
+2.489
181.73%
1 ene 1967 año
2.873
-0.986
-25.55%
1 ene 1968 año
1.365
-1.508
-52.48%
1 ene 1969 año
0.708
-0.657
-48.14%
1 ene 1970 año
2.247
+1.539
217.32%
1 ene 1971 año
-0.86
-3.106
-138.26%
1 ene 1972 año
4.953
+5.813
-676.26%
1 ene 1973 año
9.18
+4.227
85.34%
1 ene 1974 año
12.797
+3.617
39.39%
1 ene 1975 año
25.233
+12.436
97.18%
1 ene 1976 año
6.693
-18.54
-73.48%
1 ene 1977 año
4.475
-2.218
-33.15%
1 ene 1978 año
9.36
+4.885
109.18%
1 ene 1979 año
10.66
+1.3
13.89%
1 ene 1980 año
28.161
+17.501
164.17%
1 ene 1981 año
22.447
-5.714
-20.29%
1 ene 1982 año
12.975
-9.473
-42.2%
1 ene 1983 año
5.12
-7.855
-60.54%
1 ene 1984 año
13.434
+8.314
162.37%
1 ene 1985 año
20.311
+6.878
51.2%
1 ene 1986 año
25.211
+4.899
24.12%
1 ene 1987 año
31.743
+6.532
25.91%
1 ene 1988 año
21.81
-9.932
-31.29%
1 ene 1989 año
22.594
+0.784
3.59%
1 ene 1990 año
26.422
+3.828
16.94%
1 ene 1991 año
37.26
+10.838
41.02%
1 ene 1992 año
24.225
-13.035
-34.98%
1 ene 1993 año
15.193
-9.033
-37.29%
1 ene 1994 año
18.209
+3.016
19.85%
1 ene 1995 año
20.566
+2.358
12.95%
1 ene 1996 año
13.425
-7.141
-34.72%
1 ene 1997 año
9.8
-3.626
-27.01%
1 ene 1998 año
6.95
-2.85
-29.08%
1 ene 1999 año
11.553
+4.604
66.24%
1 ene 2000 año
6.752
-4.801
-41.56%
1 ene 2001 año
8.982
+2.23
33.02%
1 ene 2002 año
7.268
-1.714
-19.08%
1 ene 2003 año
10.51
+3.242
44.61%
1 ene 2004 año
14.237
+3.727
35.46%
1 ene 2005 año
4.323
-9.914
-69.63%
1 ene 2006 año
6.807
+2.484
57.46%
1 ene 2007 año
9.591
+2.784
40.9%
1 ene 2008 año
8.129
-1.463
-15.25%
1 ene 2009 año
10.155
+2.026
24.92%
1 ene 2010 año
2.592
-7.563
-74.48%
1 ene 2011 año
4.651
+2.059
79.45%
1 ene 2012 año
8.254
+3.603
77.46%
1 ene 2013 año
3.676
-4.578
-55.46%
1 ene 2014 año
2.684
-0.992
-26.99%
1 ene 2015 año
5.029
+2.345
87.37%
1 ene 2016 año
3.129
-1.9
-37.78%
Ranking de los países por los datos estadísticos actuales


Comentarios: