29
/es/
es
AIzaSyAYiBZKx7MnpbEhh9jyipgxe19OcubqV5w
April 1, 2024
189134
Maldives
MDV
true
2
1
Inflation, consumer prices (annual %)
2016,2015,2014,2013,2012,2011,2010,2009,2008,2007,2006,2005,2004,2003,2002,2001,2000,1999,1998,1997,1996,1995,1994,1993,1992,1991,1990,1983,1982,1981,1980,1979
Estas estadísticas en otros países:
AfghanistanAlbaniaAlgeriaAngolaAntigua and BarbudaArab WorldArgentinaArmeniaArubaAustraliaAustriaAzerbaijanBahamas, TheBahrainBangladeshBarbadosBelarusBelgiumBelizeBeninBhutanBoliviaBotswanaBrazilBrunei DarussalamBulgariaBurkina FasoBurundiCabo VerdeCambodiaCameroonCanadaCaribbean small statesCentral African RepublicCentral Europe and the BalticsChadChileChinaColombiaComorosCongo, Dem. Rep.Congo, Rep.Costa RicaCote d'IvoireCroatiaCyprusCzech RepublicDenmarkDjiboutiDominicaDominican RepublicEarly-demographic dividendEast Asia & PacificEast Asia & Pacific (excluding high income)East Asia & Pacific (IDA & IBRD countries)EcuadorEgypt, Arab Rep.El SalvadorEquatorial GuineaEstoniaEthiopiaEuro areaEurope & Central AsiaEurope & Central Asia (excluding high income)Europe & Central Asia (IDA & IBRD countries)European UnionFijiFinlandFragile and conflict affected situationsFranceGabonGambia, TheGeorgiaGermanyGhanaGreeceGrenadaGuatemalaGuineaGuinea-BissauGuyanaHaitiHeavily indebted poor countries (HIPC)High incomeHondurasHong Kong SAR, ChinaHungaryIBRD onlyIcelandIDA & IBRD totalIDA blendIDA onlyIDA totalIndiaIndonesiaIran, Islamic Rep.IraqIrelandIsraelItalyJamaicaJapanJordanKazakhstanKenyaKorea, Rep.KuwaitKyrgyz RepublicLao PDRLate-demographic dividendLatin America & Caribbean Latin America & Caribbean (excluding high income)Latin America & the Caribbean (IDA & IBRD countries)LatviaLeast developed countries: UN classificationLebanonLesothoLiberiaLibyaLithuaniaLow & middle incomeLow incomeLower middle incomeLuxembourgMacao SAR, ChinaMacedonia, FYRMadagascarMalawiMalaysiaMaldivesMaliMaltaMauritaniaMauritiusMexicoMiddle East & North AfricaMiddle East & North Africa (excluding high income)Middle East & North Africa (IDA & IBRD countries)Middle incomeMoldovaMongoliaMontenegroMoroccoMozambiqueMyanmarNamibiaNepalNetherlandsNew ZealandNicaraguaNigerNigeriaNorth AmericaNorwayOECD membersOmanOther small statesPakistanPanamaPapua New GuineaParaguayPeruPhilippinesPolandPortugalPost-demographic dividendPre-demographic dividendQatarRomaniaRussian FederationRwandaSamoaSao Tome and PrincipeSaudi ArabiaSenegalSerbiaSeychellesSierra LeoneSingaporeSlovak RepublicSloveniaSmall statesSolomon IslandsSouth AfricaSouth AsiaSouth Asia (IDA & IBRD)South SudanSpainSri LankaSt. Kitts and NevisSt. LuciaSt. Vincent and the GrenadinesSub-Saharan Africa Sub-Saharan Africa (excluding high income)Sub-Saharan Africa (IDA & IBRD countries)SudanSurinameSwazilandSwedenSwitzerlandSyrian Arab RepublicTajikistanTanzaniaThailandTimor-LesteTogoTongaTrinidad and TobagoTunisiaTurkeyUgandaUkraineUnited KingdomUnited StatesUpper middle incomeUruguayVanuatuVenezuela, RBVietnamWorldYemen, Rep.ZambiaZimbabwe línea de tiempo (timeline):
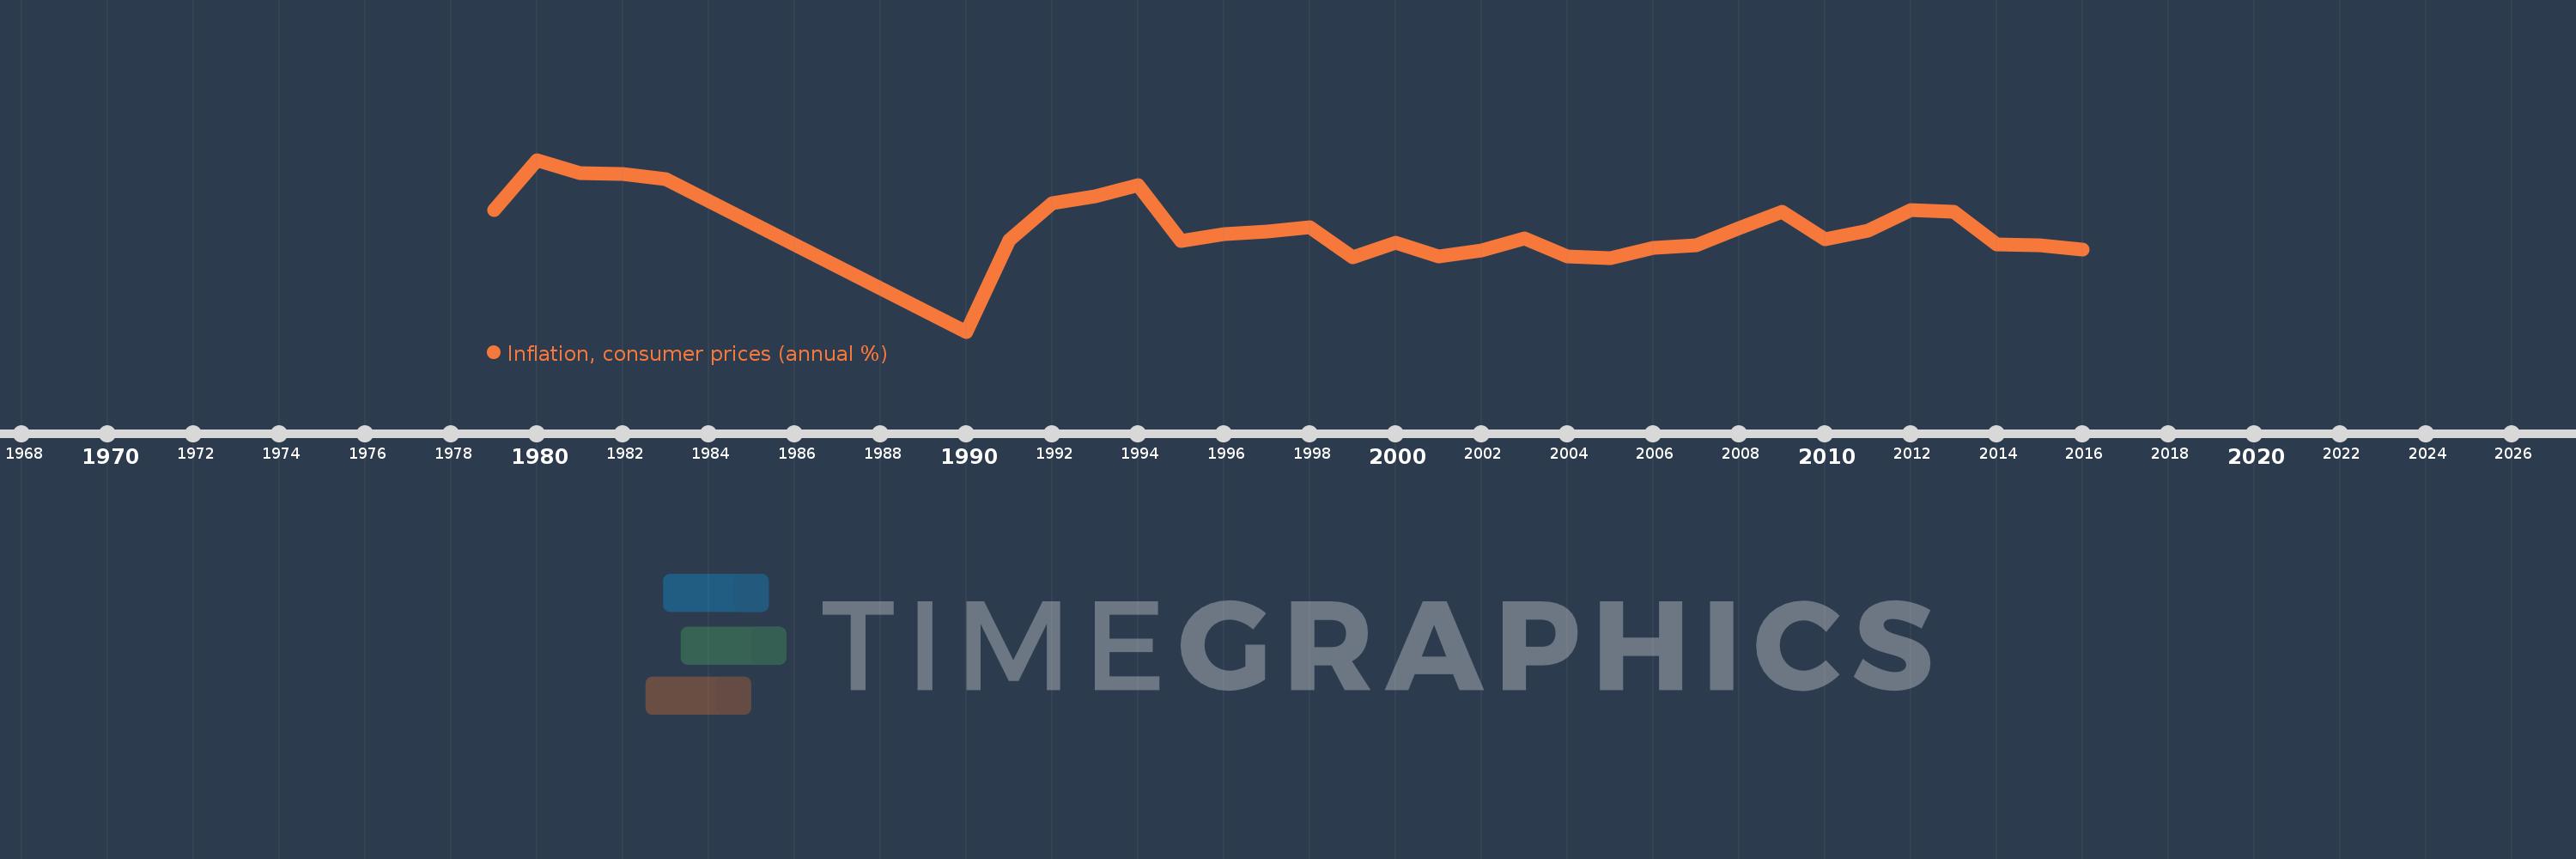
En esta escala de tiempo se presenta un gráfico de 1979 y 2016 de Maldives. Los datos de 1978 están ausentes. El número de observaciones reales por fecha: 32.
Fuente (nombre):
Indicadores del desarrollo mundial
Fuente (organización):
International Monetary Fund, International Financial Statistics and data files.
Categorías:
Economy & Growth, Financial Sector
Se ha actualizado:
23 abr 2017 año
Los indicadores de los cambios de valor en los últimos años
Mínimo:
-23.822
1 ene 1990 año
Máximo:
27.848
1 ene 1980 año
A la fecha de observación
Valor
Cambio absoluto
El cambio con respecto al valor anterior
1 ene 1979 año
12.656
+12.656
0.0%
1 ene 1980 año
27.848
+15.192
120.04%
1 ene 1981 año
23.762
-4.086
-14.67%
1 ene 1982 año
23.7
-0.062
-0.26%
1 ene 1983 año
21.989
-1.711
-7.22%
1 ene 1990 año
-23.822
-45.811
-208.34%
1 ene 1991 año
3.621
+27.443
-115.2%
1 ene 1992 año
14.73
+11.109
306.77%
1 ene 1993 año
16.848
+2.118
14.38%
1 ene 1994 año
20.134
+3.286
19.5%
1 ene 1995 año
3.386
-16.748
-83.18%
1 ene 1996 año
5.489
+2.103
62.1%
1 ene 1997 año
6.241
+0.752
13.71%
1 ene 1998 año
7.573
+1.332
21.34%
1 ene 1999 año
-1.404
-8.977
-118.54%
1 ene 2000 año
2.954
+4.358
-310.34%
1 ene 2001 año
-1.175
-4.128
-139.77%
1 ene 2002 año
0.673
+1.847
-157.25%
1 ene 2003 año
4.179
+3.506
521.29%
1 ene 2004 año
-1.261
-5.439
-130.17%
1 ene 2005 año
-1.685
-0.425
33.69%
1 ene 2006 año
1.3
+2.986
-177.15%
1 ene 2007 año
2.084
+0.783
60.24%
1 ene 2008 año
7.373
+5.289
253.87%
1 ene 2009 año
12.258
+4.885
66.25%
1 ene 2010 año
3.983
-8.275
-67.51%
1 ene 2011 año
6.609
+2.626
65.94%
1 ene 2012 año
12.83
+6.221
94.12%
1 ene 2013 año
12.131
-0.699
-5.45%
1 ene 2014 año
2.314
-9.817
-80.92%
1 ene 2015 año
2.12
-0.194
-8.38%
1 ene 2016 año
0.952
-1.168
-55.08%
Ranking de los países por los datos estadísticos actuales


Comentarios: