29
/es/
es
AIzaSyAYiBZKx7MnpbEhh9jyipgxe19OcubqV5w
April 1, 2024
213372
Nigeria
NGA
true
2
1
Net taxes on products (constant LCU)
2016,2015,2014,2013,2012,2011,2010,2009,2008,2007,2006,2005,2004,2003,2002,2001,2000,1999,1998,1997,1996,1995,1994,1993,1992,1991,1990,1989,1988,1987,1986,1985,1984,1983,1982
Estas estadísticas en otros países:
línea de tiempo (timeline):
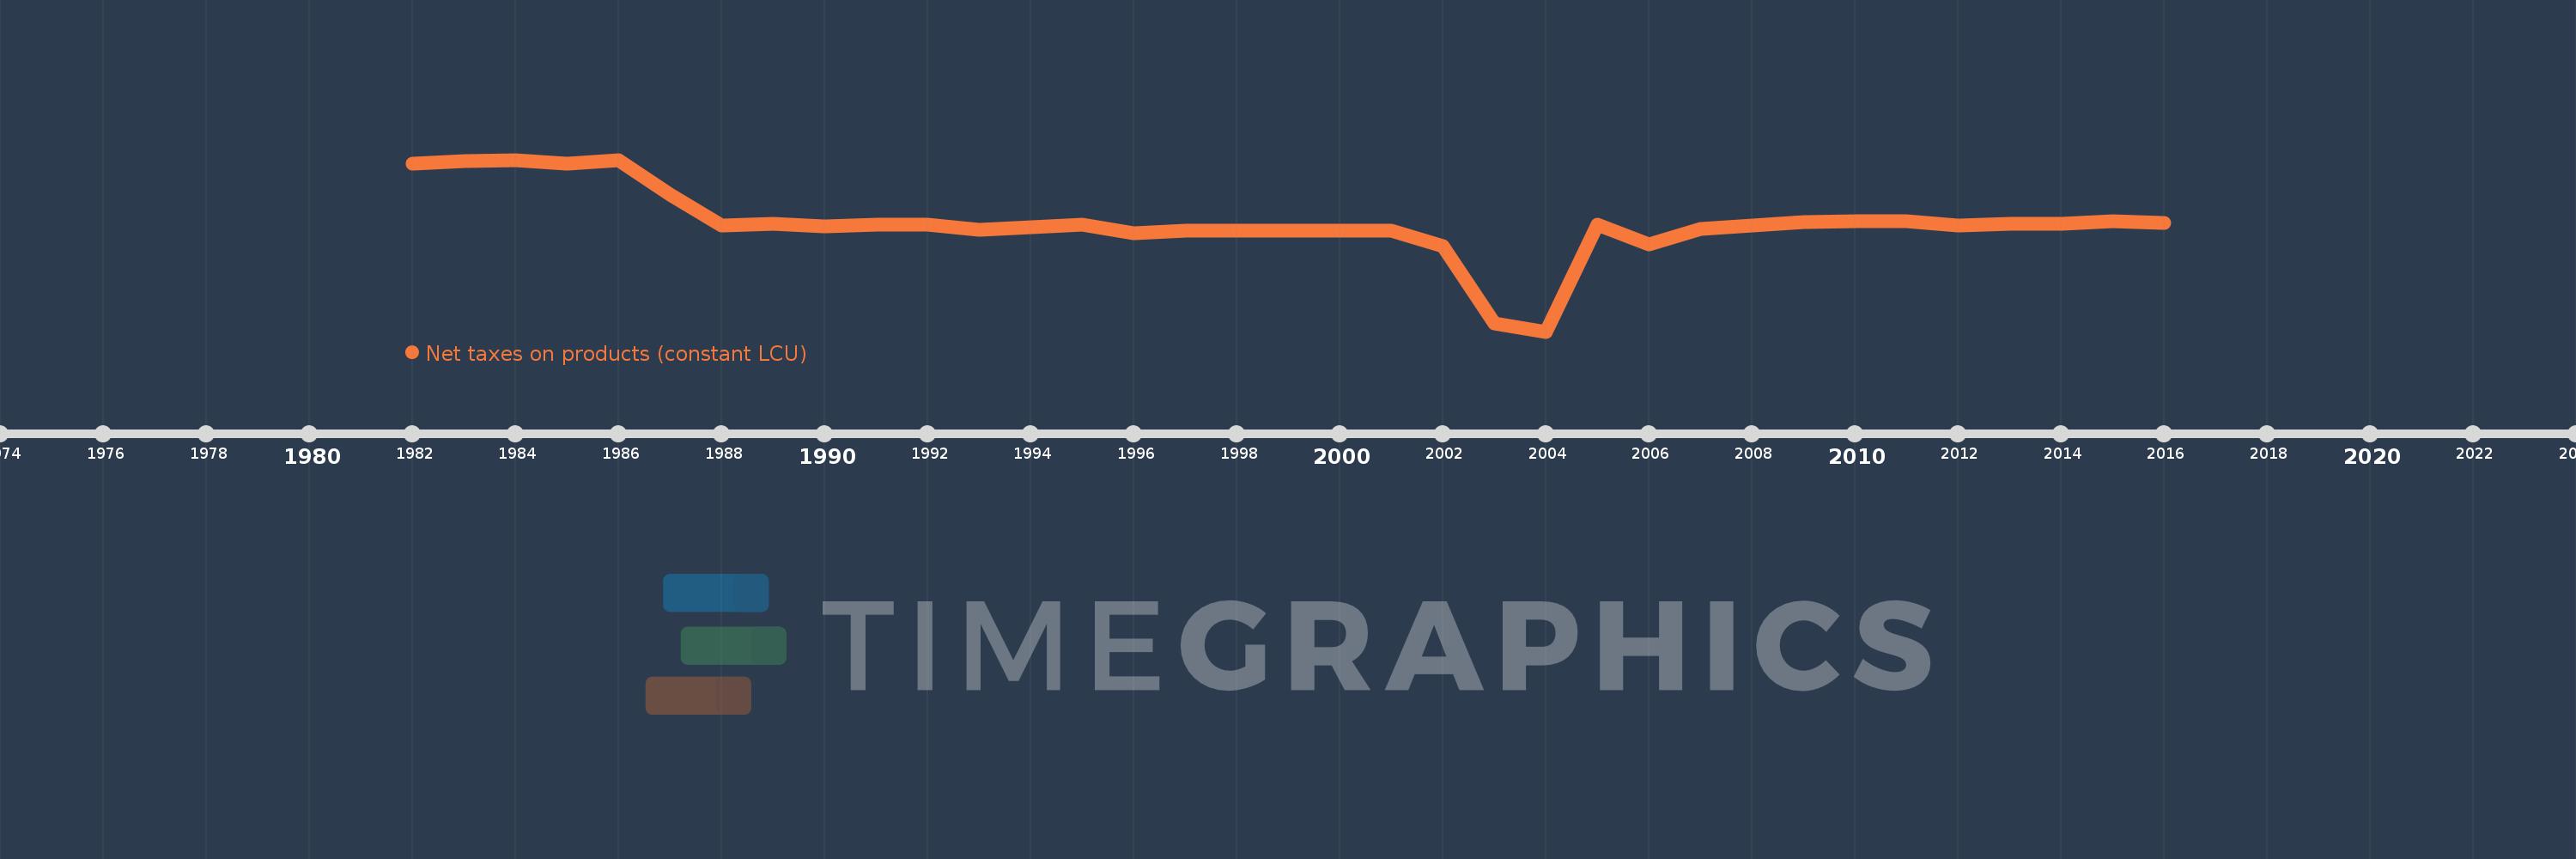
En esta escala de tiempo se presenta un gráfico de 1982 y 2016 de Nigeria. Los datos de 1981 están ausentes. El número de observaciones reales por fecha: 35.
Fuente (nombre):
Indicadores del desarrollo mundial
Fuente (organización):
World Bank national accounts data, and OECD National Accounts data files.
Categorías:
Economy & Growth
Se ha actualizado:
23 abr 2017 año
Los indicadores de los cambios de valor en los últimos años
Mínimo:
-3.615 billones
1 ene 2004 año
Máximo:
3.322 billones
1 ene 1986 año
A la fecha de observación
Valor
Cambio absoluto
El cambio con respecto al valor anterior
1 ene 1982 año
3.152 billones
+3.152 billones
0.0%
1 ene 1983 año
3.287 billones
+134.817 bn
4.28%
1 ene 1984 año
3.32 billones
+33.199 bn
1.01%
1 ene 1985 año
3.168 billones
-152.571 bn
-4.6%
1 ene 1986 año
3.322 billones
+154.34 bn
4.87%
1 ene 1987 año
1.909 billones
-1.412 billones
-42.52%
1 ene 1988 año
659.843 bn
-1.25 billones
-65.44%
1 ene 1989 año
728.449 bn
+68.606 bn
10.4%
1 ene 1990 año
644.443 bn
-84.006 bn
-11.53%
1 ene 1991 año
696.874 bn
+52.431 bn
8.14%
1 ene 1992 año
718.341 bn
+21.468 bn
3.08%
1 ene 1993 año
480.774 bn
-237.567 bn
-33.07%
1 ene 1994 año
600.569 bn
+119.795 bn
24.92%
1 ene 1995 año
699.764 bn
+99.195 bn
16.52%
1 ene 1996 año
358.949 bn
-340.815 bn
-48.7%
1 ene 1997 año
462.224 bn
+103.275 bn
28.77%
1 ene 1998 año
472.908 bn
+10.683 bn
2.31%
1 ene 1999 año
452.611 bn
-20.297 bn
-4.29%
1 ene 2000 año
463.764 bn
+11.153 bn
2.46%
1 ene 2001 año
468.864 bn
+5.1 bn
1.1%
1 ene 2002 año
-172.234 bn
-641.099 bn
-136.73%
1 ene 2003 año
-3.3 billones
-3.127 billones
1.82 mil%
1 ene 2004 año
-3.615 billones
-315.505 bn
9.56%
1 ene 2005 año
693.218 bn
+4.308 billones
-119.18%
1 ene 2006 año
-88.379 bn
-781.597 bn
-112.75%
1 ene 2007 año
514.105 bn
+602.484 bn
-681.7%
1 ene 2008 año
661.475 bn
+147.37 bn
28.67%
1 ene 2009 año
793.44 bn
+131.965 bn
19.95%
1 ene 2010 año
840.424 bn
+46.984 bn
5.92%
1 ene 2011 año
857.086 bn
+16.662 bn
1.98%
1 ene 2012 año
669.31 bn
-187.776 bn
-21.91%
1 ene 2013 año
740.157 bn
+70.847 bn
10.59%
1 ene 2014 año
724.124 bn
-16.034 bn
-2.17%
1 ene 2015 año
824.673 bn
+100.549 bn
13.89%
1 ene 2016 año
756.763 bn
-67.91 bn
-8.23%
Ranking de los países por los datos estadísticos actuales


Comentarios: