30
/es/
AIzaSyAYiBZKx7MnpbEhh9jyipgxe19OcubqV5w
April 1, 2024
152889
Hungary
HUN
true
2
1
Net taxes on products (constant LCU)
2016,2015,2014,2013,2012,2011,2010,2009,2008,2007,2006,2005,2004,2003,2002,2001,2000,1999,1998,1997,1996,1995,1994,1993,1992
Download
Estadísticas Globales de la Biblioteca →Hungary →

Net taxes on products (constant LCU)

Estas estadísticas en otros países:

AfghanistanAlbaniaAlgeriaAntigua and BarbudaArgentinaArmeniaAustraliaAustriaAzerbaijanBahamas, TheBangladeshBelarusBelgiumBelizeBeninBermudaBhutanBoliviaBosnia and HerzegovinaBotswanaBrazilBulgariaBurkina FasoBurundiCabo VerdeCambodiaCameroonCanadaCentral African RepublicChadChileColombiaCongo, Dem. Rep.Costa RicaCroatiaCubaCyprusCzech RepublicDenmarkDjiboutiDominicaDominican RepublicEcuadorEl SalvadorEquatorial GuineaEritreaEstoniaEthiopiaFijiFinlandFranceGabonGambia, TheGeorgiaGermanyGhanaGreeceGrenadaGuatemalaGuineaGuinea-BissauGuyanaHaitiHondurasHong Kong SAR, ChinaHungaryIndiaIndonesiaIran, Islamic Rep.IrelandItalyJamaicaJapanJordanKazakhstanKenyaKiribatiKorea, Rep.KosovoKyrgyz RepublicLao PDRLatviaLebanonLesothoLiberiaLithuaniaLuxembourgMacedonia, FYRMadagascarMalawiMaldivesMaliMarshall IslandsMauritaniaMauritiusMexicoMicronesia, Fed. Sts.MoldovaMongoliaMontenegroMoroccoMozambiqueNamibiaNepalNetherlandsNew ZealandNicaraguaNigerNigeriaNorwayOmanPakistanPalauPanamaPapua New GuineaParaguayPeruPhilippinesPolandPortugalRomaniaRussian FederationRwandaSao Tome and PrincipeSenegalSerbiaSeychellesSierra LeoneSingaporeSlovak RepublicSloveniaSolomon IslandsSomaliaSouth AfricaSpainSri LankaSt. Kitts and NevisSt. LuciaSt. Vincent and the GrenadinesSudanSurinameSwazilandSwedenSwitzerlandTajikistanTanzaniaTimor-LesteTongaTrinidad and TobagoTunisiaTurkeyTuvaluUgandaUkraineUnited Arab EmiratesUnited KingdomUnited StatesUruguayUzbekistanVanuatuVenezuela, RBVietnamWest Bank and GazaZambiaZimbabwe

línea de tiempo (timeline):

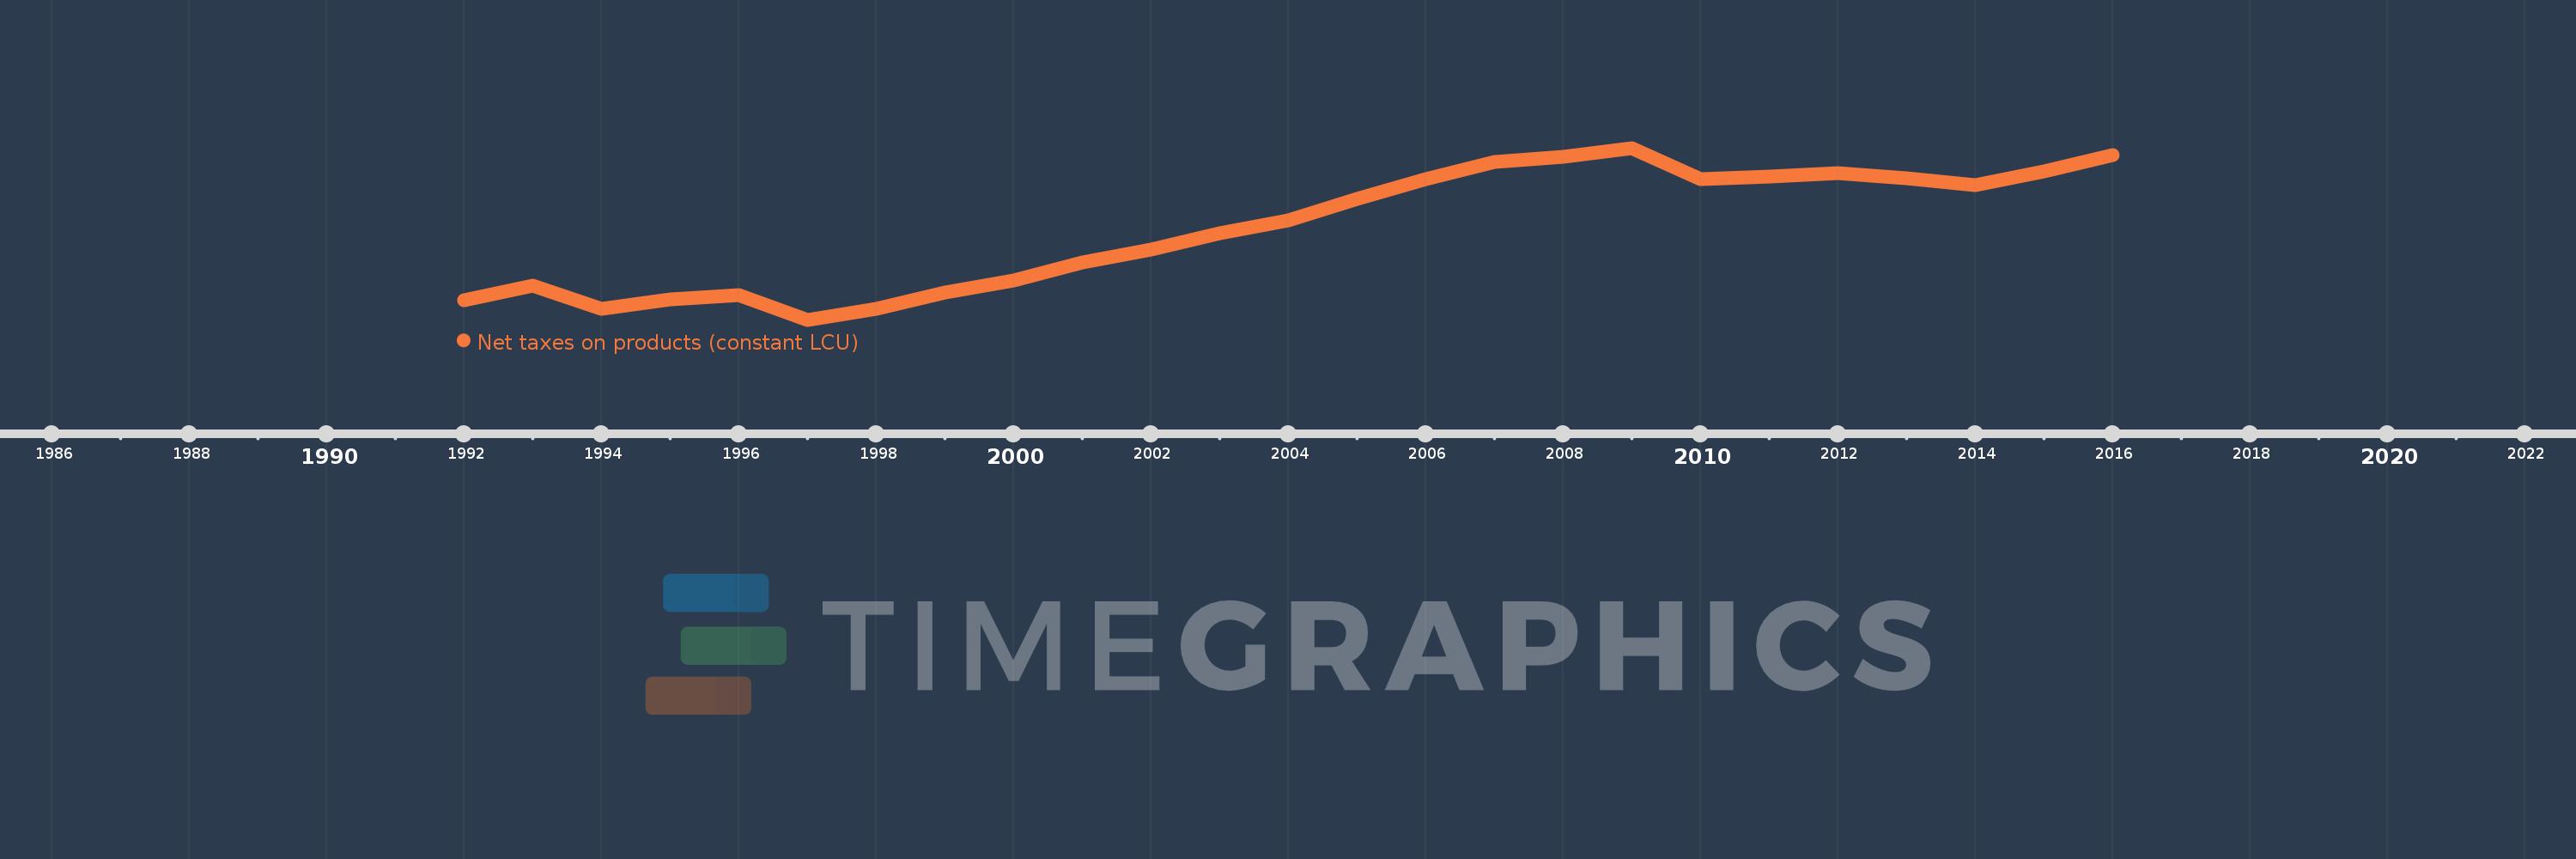
En esta escala de tiempo se presenta un gráfico de 1992 y 2016 de Hungary. Los datos de 1991 están ausentes. El número de observaciones reales por fecha: 25.

Fuente (nombre):

Indicadores del desarrollo mundial

Fuente (organización):

World Bank national accounts data, and OECD National Accounts data files.

Categorías:

Economy & Growth

Se ha actualizado:

23 abr 2017 año

Los indicadores de los cambios de valor en los últimos años

En promedio:
3.702 billones
Mínimo:
2.881 billones
1 ene 1997 año
Máximo:
4.432 billones
1 ene 2009 año
A la fecha de observación
Valor
Cambio absoluto
El cambio con respecto al valor anterior
1 ene 1992 año
3.06 billones
+3.06 billones
0.0%
1 ene 1993 año
3.188 billones
+127.586 bn
4.17%
1 ene 1994 año
2.979 billones
-208.799 bn
-6.55%
1 ene 1995 año
3.067 billones
+87.801 bn
2.95%
1 ene 1996 año
3.101 billones
+33.895 bn
1.11%
1 ene 1997 año
2.881 billones
-219.949 bn
-7.09%
1 ene 1998 año
2.983 billones
+101.724 bn
3.53%
1 ene 1999 año
3.127 billones
+144.074 bn
4.83%
1 ene 2000 año
3.239 billones
+112.241 bn
3.59%
1 ene 2001 año
3.401 billones
+162.069 bn
5.0%
1 ene 2002 año
3.512 billones
+111.182 bn
3.27%
1 ene 2003 año
3.66 billones
+148.366 bn
4.22%
1 ene 2004 año
3.776 billones
+115.834 bn
3.16%
1 ene 2005 año
3.974 billones
+197.259 bn
5.22%
1 ene 2006 año
4.152 billones
+178.505 bn
4.49%
1 ene 2007 año
4.305 billones
+152.599 bn
3.68%
1 ene 2008 año
4.35 billones
+45.028 bn
1.05%
1 ene 2009 año
4.432 billones
+82.516 bn
1.9%
1 ene 2010 año
4.152 billones
-280.514 bn
-6.33%
1 ene 2011 año
4.171 billones
+18.901 bn
0.46%
1 ene 2012 año
4.203 billones
+32.65 bn
0.78%
1 ene 2013 año
4.156 billones
-47.331 bn
-1.13%
1 ene 2014 año
4.097 billones
-59.003 bn
-1.42%
1 ene 2015 año
4.22 billones
+123.264 bn
3.01%
1 ene 2016 año
4.366 billones
+145.473 bn
3.45%

Ranking de los países por los datos estadísticos actuales