29
/es/
es
AIzaSyAYiBZKx7MnpbEhh9jyipgxe19OcubqV5w
April 1, 2024
209311
New Zealand
NZL
true
2
1
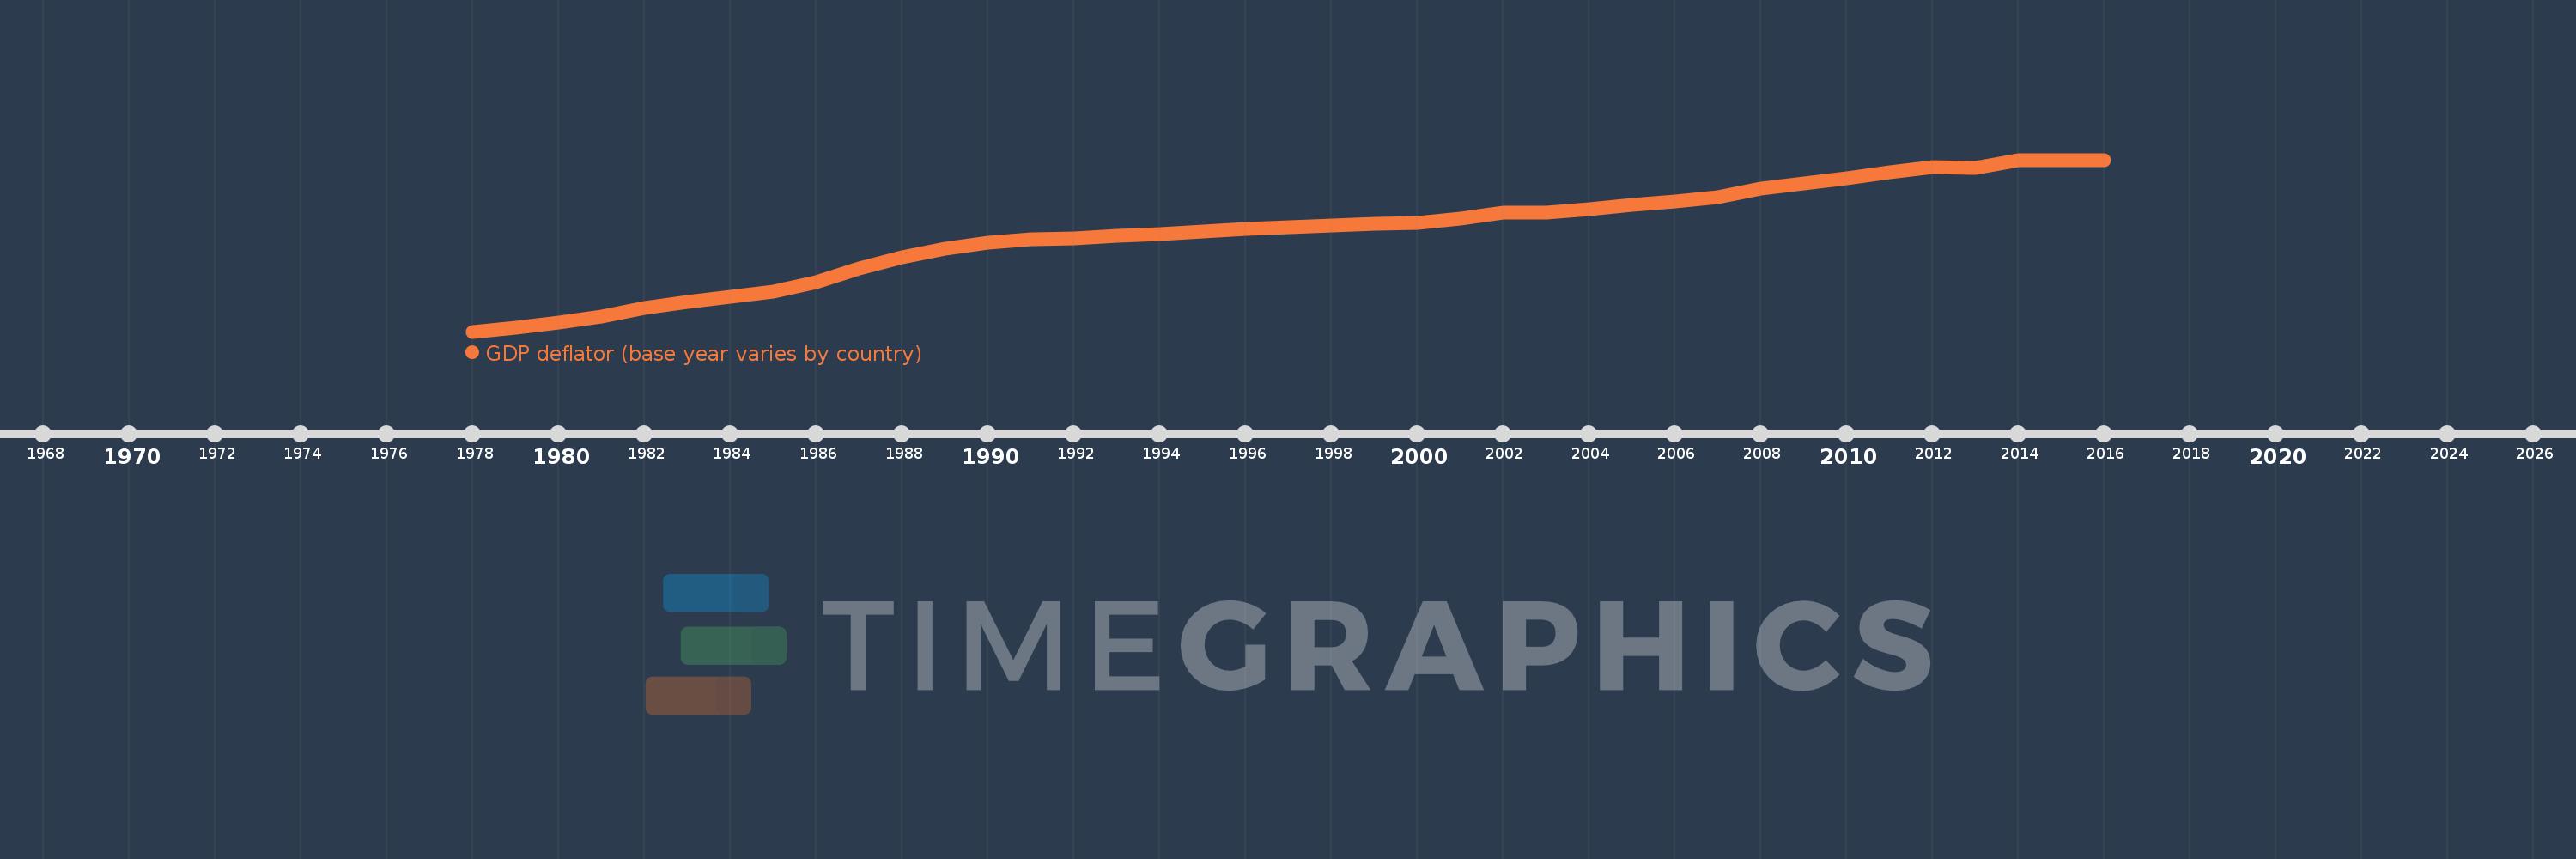
GDP deflator (base year varies by country)
2016,2015,2014,2013,2012,2011,2010,2009,2008,2007,2006,2005,2004,2003,2002,2001,2000,1999,1998,1997,1996,1995,1994,1993,1992,1991,1990,1989,1988,1987,1986,1985,1984,1983,1982,1981,1980,1979,1978
Estas estadísticas en otros países:
AfghanistanAlbaniaAlgeriaAndorraAngolaAntigua and BarbudaArgentinaArmeniaArubaAustraliaAustriaAzerbaijanBahamas, TheBahrainBangladeshBarbadosBelarusBelgiumBelizeBeninBermudaBhutanBoliviaBosnia and HerzegovinaBotswanaBrazilBrunei DarussalamBulgariaBurkina FasoBurundiCabo VerdeCambodiaCameroonCanadaCayman IslandsCentral African RepublicChadChannel IslandsChileChinaColombiaComorosCongo, Dem. Rep.Congo, Rep.Costa RicaCote d'IvoireCroatiaCubaCyprusCzech RepublicDenmarkDjiboutiDominicaDominican RepublicEcuadorEgypt, Arab Rep.El SalvadorEquatorial GuineaEritreaEstoniaEthiopiaFijiFinlandFranceFrench PolynesiaGabonGambia, TheGeorgiaGermanyGhanaGreeceGreenlandGrenadaGuatemalaGuineaGuinea-BissauGuyanaHaitiHondurasHong Kong SAR, ChinaHungaryIcelandIndiaIndonesiaIran, Islamic Rep.IraqIrelandIsle of ManIsraelItalyJamaicaJapanJordanKazakhstanKenyaKiribatiKorea, Rep.KosovoKuwaitKyrgyz RepublicLao PDRLatviaLebanonLesothoLiberiaLibyaLiechtensteinLithuaniaLuxembourgMacao SAR, ChinaMacedonia, FYRMadagascarMalawiMalaysiaMaldivesMaliMaltaMarshall IslandsMauritaniaMauritiusMexicoMicronesia, Fed. Sts.MoldovaMonacoMongoliaMontenegroMoroccoMozambiqueMyanmarNamibiaNauruNepalNetherlandsNew CaledoniaNew ZealandNicaraguaNigerNigeriaNorwayOmanPakistanPalauPanamaPapua New GuineaParaguayPeruPhilippinesPolandPortugalPuerto RicoQatarRomaniaRussian FederationRwandaSamoaSan MarinoSao Tome and PrincipeSaudi ArabiaSenegalSerbiaSeychellesSierra LeoneSingaporeSlovak RepublicSloveniaSolomon IslandsSomaliaSouth AfricaSouth SudanSpainSri LankaSt. Kitts and NevisSt. LuciaSt. Vincent and the GrenadinesSudanSurinameSwazilandSwedenSwitzerlandSyrian Arab RepublicTajikistanTanzaniaThailandTimor-LesteTogoTongaTrinidad and TobagoTunisiaTurkeyTurkmenistanTuvaluUgandaUkraineUnited Arab EmiratesUnited KingdomUnited StatesUruguayUzbekistanVanuatuVenezuela, RBVietnamVirgin Islands (U.S.)West Bank and GazaYemen, Rep.ZambiaZimbabwe línea de tiempo (timeline):
En esta escala de tiempo se presenta un gráfico de 1978 y 2016 de New Zealand. Los datos de 1977 están ausentes. El número de observaciones reales por fecha: 39.
Fuente (nombre):
Indicadores del desarrollo mundial
Fuente (organización):
World Bank national accounts data, and OECD National Accounts data files.
Categorías:
Economy & Growth
Se ha actualizado:
23 abr 2017 año
Los indicadores de los cambios de valor en los últimos años
Mínimo:
16.677
1 ene 1978 año
Máximo:
106.276
1 ene 2015 año
A la fecha de observación
Valor
Cambio absoluto
El cambio con respecto al valor anterior
1 ene 1978 año
16.677
+16.677
0.0%
1 ene 1979 año
18.843
+2.165
12.98%
1 ene 1980 año
21.523
+2.68
14.23%
1 ene 1981 año
24.733
+3.21
14.91%
1 ene 1982 año
28.775
+4.042
16.34%
1 ene 1983 año
32.253
+3.477
12.08%
1 ene 1984 año
34.744
+2.491
7.72%
1 ene 1985 año
37.453
+2.71
7.8%
1 ene 1986 año
42.562
+5.108
13.64%
1 ene 1987 año
49.775
+7.213
16.95%
1 ene 1988 año
55.491
+5.716
11.48%
1 ene 1989 año
59.872
+4.381
7.9%
1 ene 1990 año
63.253
+3.38
5.65%
1 ene 1991 año
64.798
+1.545
2.44%
1 ene 1992 año
65.372
+0.574
0.89%
1 ene 1993 año
66.665
+1.293
1.98%
1 ene 1994 año
67.635
+0.971
1.46%
1 ene 1995 año
68.934
+1.299
1.92%
1 ene 1996 año
70.007
+1.073
1.56%
1 ene 1997 año
70.965
+0.958
1.37%
1 ene 1998 año
72.146
+1.181
1.66%
1 ene 1999 año
73.085
+0.939
1.3%
1 ene 2000 año
73.419
+0.333
0.46%
1 ene 2001 año
75.614
+2.195
2.99%
1 ene 2002 año
78.515
+2.901
3.84%
1 ene 2003 año
78.629
+0.114
0.15%
1 ene 2004 año
80.326
+1.697
2.16%
1 ene 2005 año
82.764
+2.438
3.03%
1 ene 2006 año
84.38
+1.616
1.95%
1 ene 2007 año
86.597
+2.217
2.63%
1 ene 2008 año
91.392
+4.796
5.54%
1 ene 2009 año
93.979
+2.586
2.83%
1 ene 2010 año
96.795
+2.817
3.0%
1 ene 2011 año
100.0
+3.205
3.31%
1 ene 2012 año
102.29
+2.29
2.29%
1 ene 2013 año
102.191
-0.099
-0.1%
1 ene 2014 año
106.093
+3.902
3.82%
1 ene 2015 año
106.276
+0.183
0.17%
1 ene 2016 año
106.153
-0.122
-0.12%
Ranking de los países por los datos estadísticos actuales


Comentarios: