29
/es/
es
AIzaSyAYiBZKx7MnpbEhh9jyipgxe19OcubqV5w
April 1, 2024
193022
Mauritania
MRT
true
2
1
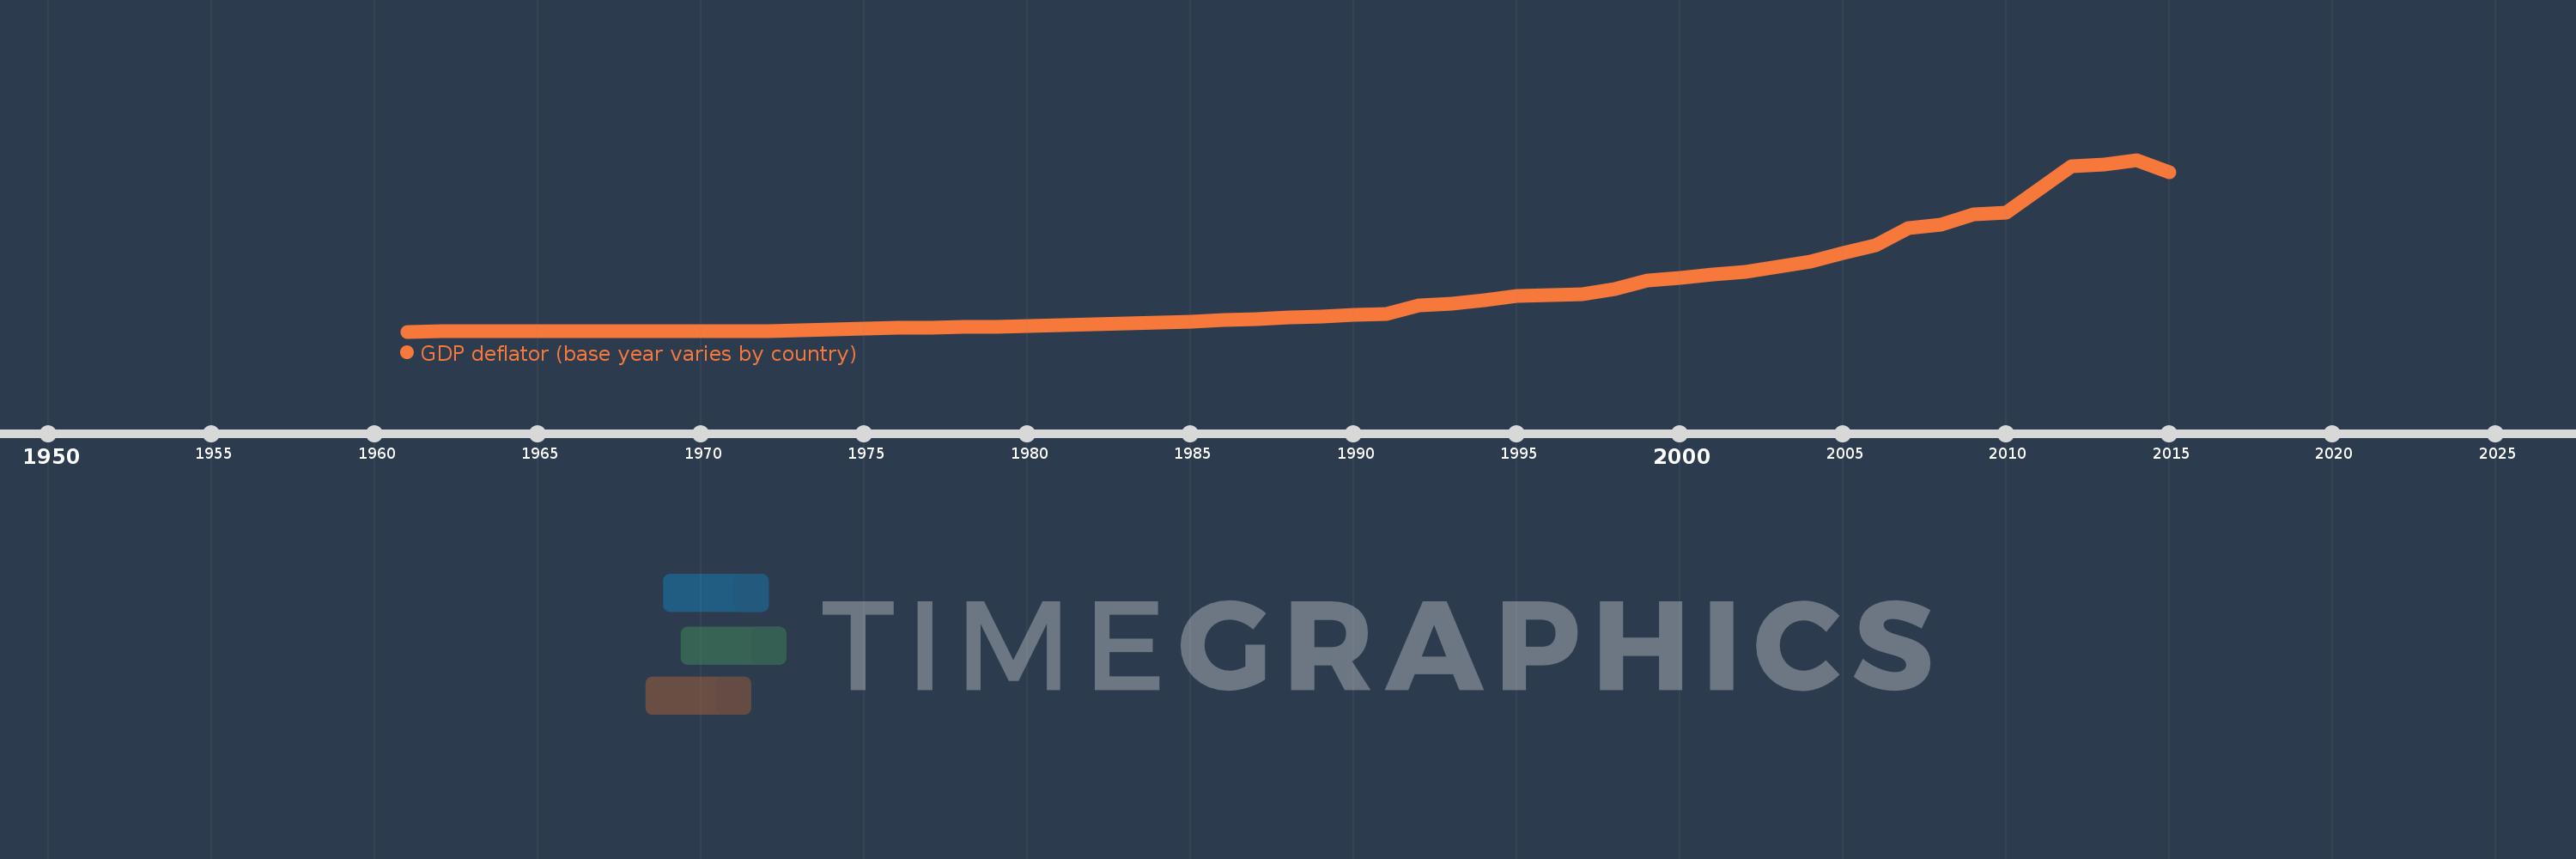
GDP deflator (base year varies by country)
2015,2014,2013,2012,2011,2010,2009,2008,2007,2006,2005,2004,2003,2002,2001,2000,1999,1998,1997,1996,1995,1994,1993,1992,1991,1990,1989,1988,1987,1986,1985,1984,1983,1982,1981,1980,1979,1978,1977,1976,1975,1974,1973,1972,1971,1970,1969,1968,1967,1966,1965,1964,1963,1962,1961
Estas estadísticas en otros países:
AfghanistanAlbaniaAlgeriaAndorraAngolaAntigua and BarbudaArgentinaArmeniaArubaAustraliaAustriaAzerbaijanBahamas, TheBahrainBangladeshBarbadosBelarusBelgiumBelizeBeninBermudaBhutanBoliviaBosnia and HerzegovinaBotswanaBrazilBrunei DarussalamBulgariaBurkina FasoBurundiCabo VerdeCambodiaCameroonCanadaCayman IslandsCentral African RepublicChadChannel IslandsChileChinaColombiaComorosCongo, Dem. Rep.Congo, Rep.Costa RicaCote d'IvoireCroatiaCubaCyprusCzech RepublicDenmarkDjiboutiDominicaDominican RepublicEcuadorEgypt, Arab Rep.El SalvadorEquatorial GuineaEritreaEstoniaEthiopiaFijiFinlandFranceFrench PolynesiaGabonGambia, TheGeorgiaGermanyGhanaGreeceGreenlandGrenadaGuatemalaGuineaGuinea-BissauGuyanaHaitiHondurasHong Kong SAR, ChinaHungaryIcelandIndiaIndonesiaIran, Islamic Rep.IraqIrelandIsle of ManIsraelItalyJamaicaJapanJordanKazakhstanKenyaKiribatiKorea, Rep.KosovoKuwaitKyrgyz RepublicLao PDRLatviaLebanonLesothoLiberiaLibyaLiechtensteinLithuaniaLuxembourgMacao SAR, ChinaMacedonia, FYRMadagascarMalawiMalaysiaMaldivesMaliMaltaMarshall IslandsMauritaniaMauritiusMexicoMicronesia, Fed. Sts.MoldovaMonacoMongoliaMontenegroMoroccoMozambiqueMyanmarNamibiaNauruNepalNetherlandsNew CaledoniaNew ZealandNicaraguaNigerNigeriaNorwayOmanPakistanPalauPanamaPapua New GuineaParaguayPeruPhilippinesPolandPortugalPuerto RicoQatarRomaniaRussian FederationRwandaSamoaSan MarinoSao Tome and PrincipeSaudi ArabiaSenegalSerbiaSeychellesSierra LeoneSingaporeSlovak RepublicSloveniaSolomon IslandsSomaliaSouth AfricaSouth SudanSpainSri LankaSt. Kitts and NevisSt. LuciaSt. Vincent and the GrenadinesSudanSurinameSwazilandSwedenSwitzerlandSyrian Arab RepublicTajikistanTanzaniaThailandTimor-LesteTogoTongaTrinidad and TobagoTunisiaTurkeyTurkmenistanTuvaluUgandaUkraineUnited Arab EmiratesUnited KingdomUnited StatesUruguayUzbekistanVanuatuVenezuela, RBVietnamVirgin Islands (U.S.)West Bank and GazaYemen, Rep.ZambiaZimbabwe línea de tiempo (timeline):
En esta escala de tiempo se presenta un gráfico de 1961 y 2015 de Mauritania. Los datos de 1960 están ausentes. El número de observaciones reales por fecha: 55.
Fuente (nombre):
Indicadores del desarrollo mundial
Fuente (organización):
World Bank national accounts data, and OECD National Accounts data files.
Categorías:
Economy & Growth
Se ha actualizado:
23 abr 2017 año
Los indicadores de los cambios de valor en los últimos años
Mínimo:
4.314
1 ene 1961 año
Máximo:
212.787
1 ene 2014 año
A la fecha de observación
Valor
Cambio absoluto
El cambio con respecto al valor anterior
1 ene 1961 año
4.314
+4.314
0.0%
1 ene 1962 año
4.343
+0.03
0.69%
1 ene 1963 año
4.449
+0.106
2.43%
1 ene 1964 año
4.647
+0.198
4.46%
1 ene 1965 año
4.858
+0.211
4.53%
1 ene 1966 año
4.758
-0.1
-2.07%
1 ene 1967 año
4.955
+0.197
4.14%
1 ene 1968 año
5.073
+0.118
2.38%
1 ene 1969 año
5.072
-0.001
-0.01%
1 ene 1970 año
4.994
-0.078
-1.54%
1 ene 1971 año
5.0
+0.006
0.13%
1 ene 1972 año
5.314
+0.314
6.27%
1 ene 1973 año
5.693
+0.378
7.12%
1 ene 1974 año
6.633
+0.94
16.51%
1 ene 1975 año
7.474
+0.841
12.68%
1 ene 1976 año
8.595
+1.121
15.0%
1 ene 1977 año
9.114
+0.518
6.03%
1 ene 1978 año
9.696
+0.582
6.39%
1 ene 1979 año
9.937
+0.241
2.49%
1 ene 1980 año
11.153
+1.216
12.23%
1 ene 1981 año
11.883
+0.73
6.55%
1 ene 1982 año
12.746
+0.863
7.27%
1 ene 1983 año
14.032
+1.286
10.09%
1 ene 1984 año
15.05
+1.018
7.26%
1 ene 1985 año
16.692
+1.642
10.91%
1 ene 1986 año
18.403
+1.71
10.24%
1 ene 1987 año
19.739
+1.336
7.26%
1 ene 1988 año
21.804
+2.065
10.46%
1 ene 1989 año
22.977
+1.174
5.38%
1 ene 1990 año
24.81
+1.833
7.98%
1 ene 1991 año
25.466
+0.656
2.64%
1 ene 1992 año
36.012
+10.546
41.41%
1 ene 1993 año
38.08
+2.068
5.74%
1 ene 1994 año
42.616
+4.536
11.91%
1 ene 1995 año
47.343
+4.727
11.09%
1 ene 1996 año
48.689
+1.345
2.84%
1 ene 1997 año
49.593
+0.904
1.86%
1 ene 1998 año
55.582
+5.989
12.08%
1 ene 1999 año
65.838
+10.256
18.45%
1 ene 2000 año
69.456
+3.618
5.49%
1 ene 2001 año
73.209
+3.753
5.4%
1 ene 2002 año
76.898
+3.688
5.04%
1 ene 2003 año
83.014
+6.117
7.95%
1 ene 2004 año
89.483
+6.469
7.79%
1 ene 2005 año
100.0
+10.517
11.75%
1 ene 2006 año
109.555
+9.555
9.56%
1 ene 2007 año
129.776
+20.221
18.46%
1 ene 2008 año
134.144
+4.368
3.37%
1 ene 2009 año
146.806
+12.663
9.44%
1 ene 2010 año
148.453
+1.646
1.12%
1 ene 2011 año
176.477
+28.024
18.88%
1 ene 2012 año
204.543
+28.066
15.9%
1 ene 2013 año
206.564
+2.02
0.99%
1 ene 2014 año
212.787
+6.223
3.01%
1 ene 2015 año
197.697
-15.09
-7.09%
Ranking de los países por los datos estadísticos actuales


Comentarios: