29
/es/
es
AIzaSyAYiBZKx7MnpbEhh9jyipgxe19OcubqV5w
April 1, 2024
194509
Mauritius
MUS
true
2
1
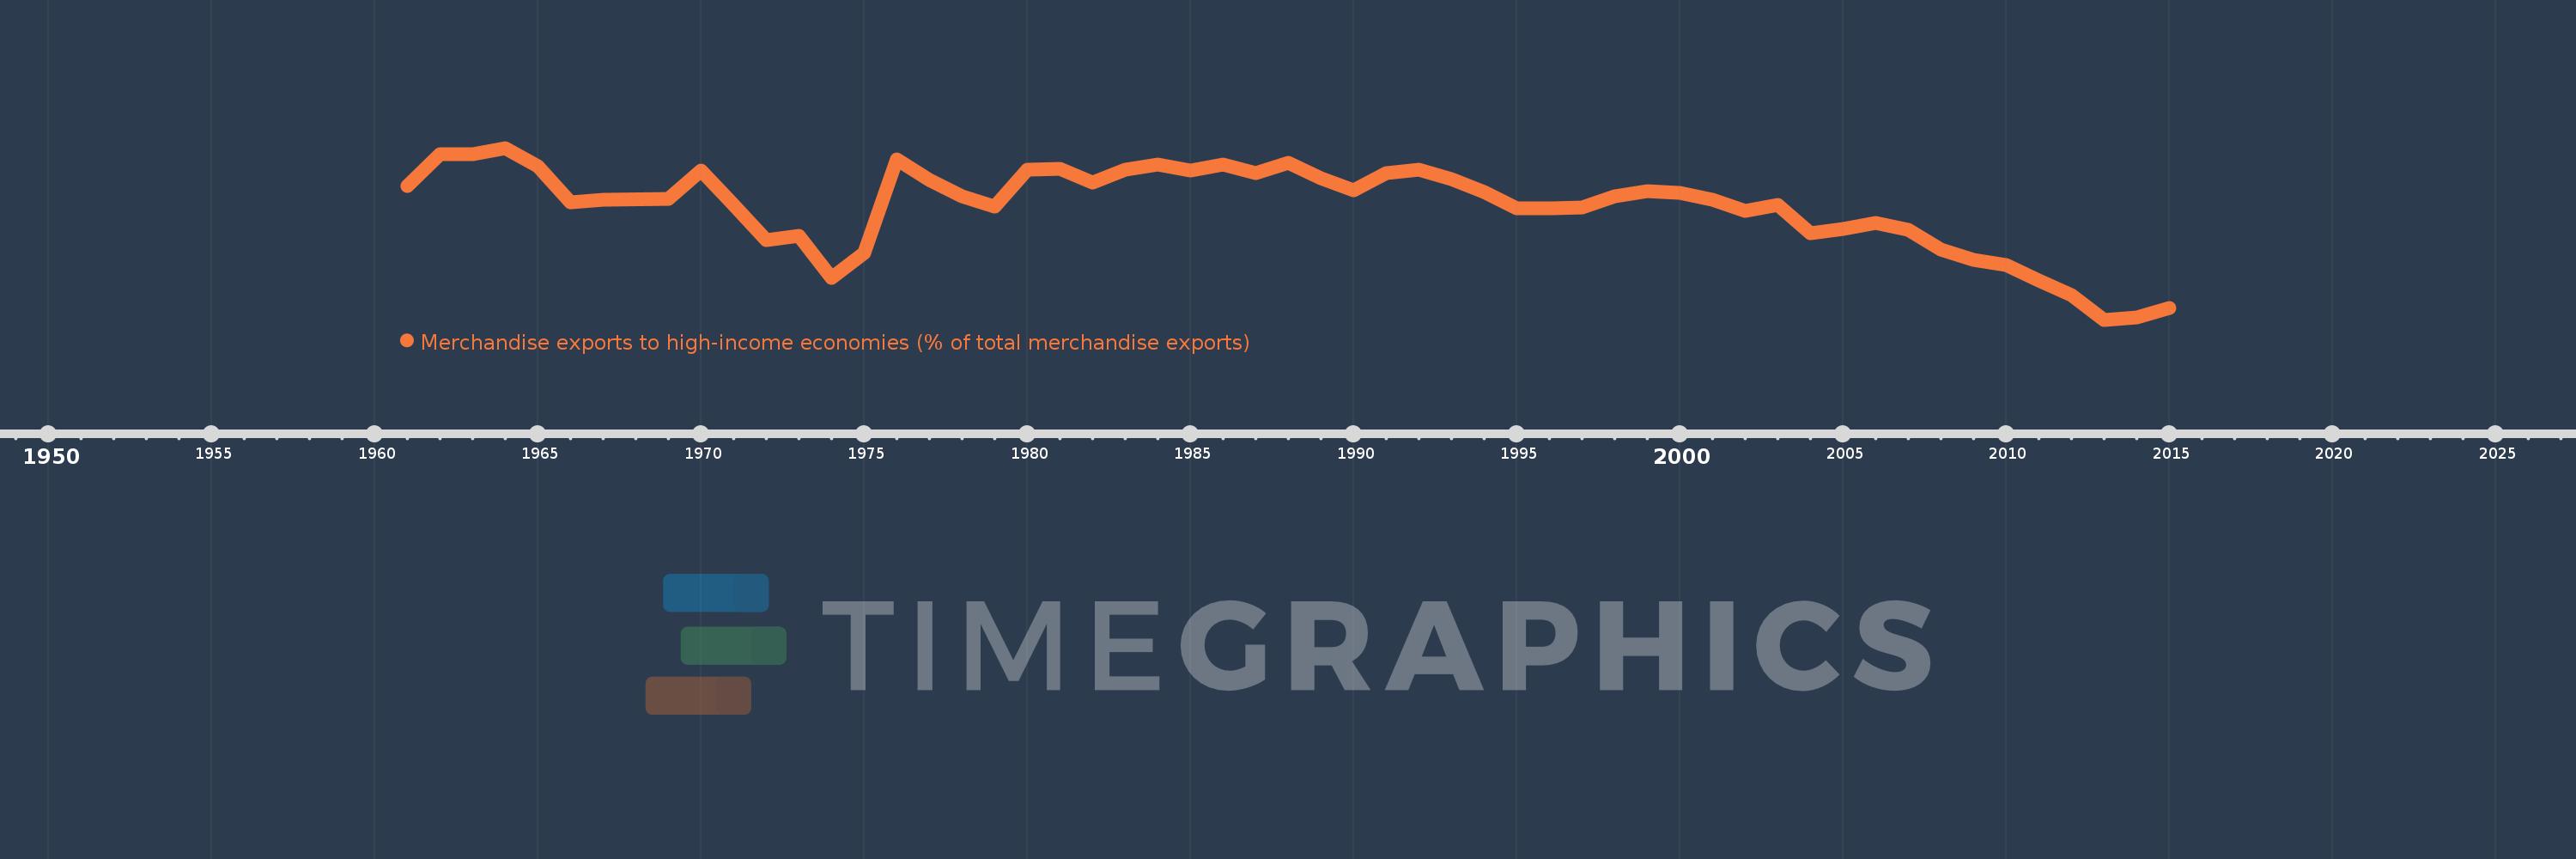
Merchandise exports to high-income economies (% of total merchandise exports)
2015,2014,2013,2012,2011,2010,2009,2008,2007,2006,2005,2004,2003,2002,2001,2000,1999,1998,1997,1996,1995,1994,1993,1992,1991,1990,1989,1988,1987,1986,1985,1984,1983,1982,1981,1980,1979,1978,1977,1976,1975,1974,1973,1972,1971,1970,1969,1967,1966,1965,1964,1963,1962,1961
Estas estadísticas en otros países:
AfghanistanAlbaniaAlgeriaAmerican SamoaAngolaAntigua and BarbudaArab WorldArgentinaArmeniaArubaAustraliaAustriaAzerbaijanBahamas, TheBahrainBangladeshBarbadosBelarusBelgiumBelizeBeninBermudaBoliviaBosnia and HerzegovinaBrazilBrunei DarussalamBulgariaBurkina FasoBurundiCabo VerdeCambodiaCameroonCanadaCaribbean small statesCentral African RepublicCentral Europe and the BalticsChadChileChinaColombiaComorosCongo, Dem. Rep.Congo, Rep.Costa RicaCote d'IvoireCroatiaCubaCyprusCzech RepublicDenmarkDjiboutiDominicaDominican RepublicEarly-demographic dividendEast Asia & PacificEast Asia & Pacific (excluding high income)East Asia & Pacific (IDA & IBRD countries)EcuadorEgypt, Arab Rep.El SalvadorEquatorial GuineaEstoniaEthiopiaEuro areaEurope & Central AsiaEurope & Central Asia (excluding high income)Europe & Central Asia (IDA & IBRD countries)European UnionFaroe IslandsFijiFinlandFragile and conflict affected situationsFranceFrench PolynesiaGabonGambia, TheGeorgiaGermanyGhanaGibraltarGreeceGreenlandGrenadaGuamGuatemalaGuineaGuinea-BissauGuyanaHaitiHeavily indebted poor countries (HIPC)High incomeHondurasHong Kong SAR, ChinaHungaryIBRD onlyIcelandIDA & IBRD totalIDA blendIDA onlyIDA totalIndiaIndonesiaIran, Islamic Rep.IraqIrelandIsraelItalyJamaicaJapanJordanKazakhstanKenyaKiribatiKorea, Dem. People’s Rep.Korea, Rep.KosovoKuwaitKyrgyz RepublicLao PDRLate-demographic dividendLatin America & Caribbean Latin America & Caribbean (excluding high income)Latin America & the Caribbean (IDA & IBRD countries)LatviaLeast developed countries: UN classificationLebanonLiberiaLibyaLithuaniaLow & middle incomeLow incomeLower middle incomeLuxembourgMacao SAR, ChinaMacedonia, FYRMadagascarMalawiMalaysiaMaldivesMaliMaltaMauritaniaMauritiusMexicoMiddle East & North AfricaMiddle East & North Africa (excluding high income)Middle East & North Africa (IDA & IBRD countries)Middle incomeMoldovaMongoliaMontenegroMoroccoMozambiqueMyanmarNauruNepalNetherlandsNew CaledoniaNew ZealandNicaraguaNigerNigeriaNorth AmericaNorwayOECD membersOmanOther small statesPacific island small statesPakistanPanamaPapua New GuineaParaguayPeruPhilippinesPolandPortugalPost-demographic dividendPre-demographic dividendQatarRomaniaRussian FederationRwandaSamoaSao Tome and PrincipeSaudi ArabiaSenegalSerbiaSeychellesSierra LeoneSingaporeSlovak RepublicSloveniaSmall statesSolomon IslandsSomaliaSouth AfricaSouth AsiaSouth Asia (IDA & IBRD)SpainSri LankaSt. Kitts and NevisSt. LuciaSt. Vincent and the GrenadinesSub-Saharan Africa Sub-Saharan Africa (excluding high income)Sub-Saharan Africa (IDA & IBRD countries)SudanSurinameSwedenSwitzerlandSyrian Arab RepublicTajikistanTanzaniaThailandTogoTongaTrinidad and TobagoTunisiaTurkeyTurkmenistanTuvaluUgandaUkraineUnited Arab EmiratesUnited KingdomUnited StatesUpper middle incomeUruguayUzbekistanVanuatuVenezuela, RBVietnamWorldYemen, Rep.ZambiaZimbabwe línea de tiempo (timeline):
En esta escala de tiempo se presenta un gráfico de 1961 y 2015 de Mauritius. Los datos de 1960 están ausentes. El número de observaciones reales por fecha: 54.
Fuente (nombre):
Indicadores del desarrollo mundial
Fuente (organización):
World Bank staff estimates based data from International Monetary Fund's Direction of Trade database.
Categorías:
Private Sector, Trade
Se ha actualizado:
23 abr 2017 año
Los indicadores de los cambios de valor en los últimos años
Mínimo:
77.396
1 ene 2013 año
Máximo:
98.434
1 ene 1964 año
A la fecha de observación
Valor
Cambio absoluto
El cambio con respecto al valor anterior
1 ene 1961 año
93.814
+93.814
0.0%
1 ene 1962 año
97.682
+3.868
4.12%
1 ene 1963 año
97.674
-0.008
-0.01%
1 ene 1964 año
98.434
+0.759
0.78%
1 ene 1965 año
96.159
-2.275
-2.31%
1 ene 1966 año
91.793
-4.365
-4.54%
1 ene 1967 año
92.077
+0.283
0.31%
1 ene 1969 año
92.157
+0.08
0.09%
1 ene 1970 año
95.628
+3.471
3.77%
1 ene 1971 año
91.468
-4.16
-4.35%
1 ene 1972 año
87.167
-4.301
-4.7%
1 ene 1973 año
87.71
+0.543
0.62%
1 ene 1974 año
82.565
-5.145
-5.87%
1 ene 1975 año
85.546
+2.981
3.61%
1 ene 1976 año
97.084
+11.538
13.49%
1 ene 1977 año
94.502
-2.582
-2.66%
1 ene 1978 año
92.494
-2.007
-2.12%
1 ene 1979 año
91.25
-1.244
-1.35%
1 ene 1980 año
95.731
+4.481
4.91%
1 ene 1981 año
95.913
+0.183
0.19%
1 ene 1982 año
94.181
-1.733
-1.81%
1 ene 1983 año
95.798
+1.618
1.72%
1 ene 1984 año
96.369
+0.571
0.6%
1 ene 1985 año
95.618
-0.752
-0.78%
1 ene 1986 año
96.396
+0.778
0.81%
1 ene 1987 año
95.334
-1.062
-1.1%
1 ene 1988 año
96.575
+1.241
1.3%
1 ene 1989 año
94.711
-1.864
-1.93%
1 ene 1990 año
93.282
-1.429
-1.51%
1 ene 1991 año
95.37
+2.088
2.24%
1 ene 1992 año
95.735
+0.365
0.38%
1 ene 1993 año
94.629
-1.106
-1.16%
1 ene 1994 año
93.011
-1.617
-1.71%
1 ene 1995 año
90.988
-2.024
-2.18%
1 ene 1996 año
91.042
+0.054
0.06%
1 ene 1997 año
91.155
+0.113
0.12%
1 ene 1998 año
92.5
+1.345
1.48%
1 ene 1999 año
93.158
+0.658
0.71%
1 ene 2000 año
92.916
-0.242
-0.26%
1 ene 2001 año
92.059
-0.857
-0.92%
1 ene 2002 año
90.723
-1.336
-1.45%
1 ene 2003 año
91.471
+0.748
0.82%
1 ene 2004 año
87.966
-3.505
-3.83%
1 ene 2005 año
88.517
+0.551
0.63%
1 ene 2006 año
89.294
+0.778
0.88%
1 ene 2007 año
88.414
-0.881
-0.99%
1 ene 2008 año
86.015
-2.399
-2.71%
1 ene 2009 año
84.71
-1.304
-1.52%
1 ene 2010 año
84.075
-0.635
-0.75%
1 ene 2011 año
82.152
-1.923
-2.29%
1 ene 2012 año
80.386
-1.766
-2.15%
1 ene 2013 año
77.396
-2.99
-3.72%
1 ene 2014 año
77.68
+0.283
0.37%
1 ene 2015 año
78.802
+1.123
1.45%
Ranking de los países por los datos estadísticos actuales


Comentarios: