29
/es/
es
AIzaSyAYiBZKx7MnpbEhh9jyipgxe19OcubqV5w
April 1, 2024
100189
Cameroon
CMR
true
2
1
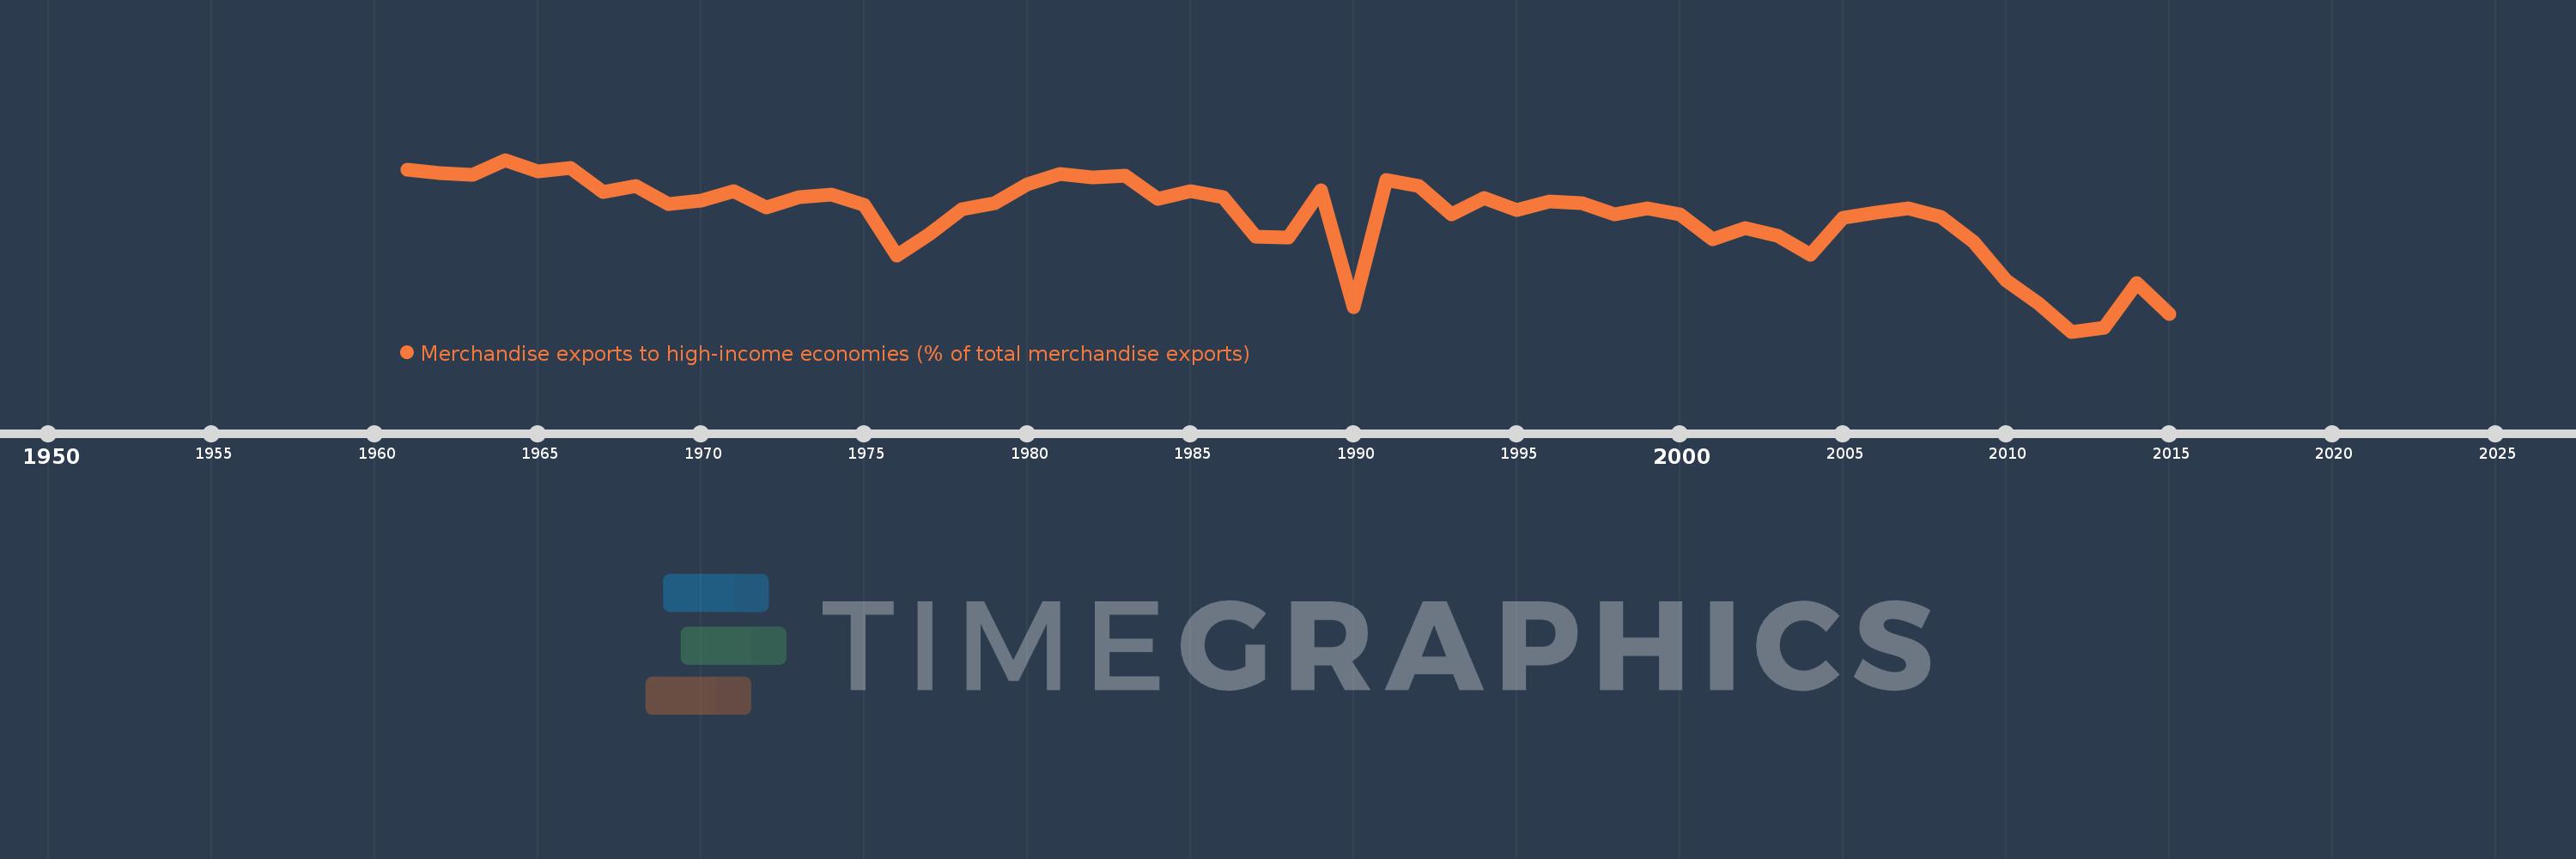
Merchandise exports to high-income economies (% of total merchandise exports)
2015,2014,2013,2012,2011,2010,2009,2008,2007,2006,2005,2004,2003,2002,2001,2000,1999,1998,1997,1996,1995,1994,1993,1992,1991,1990,1989,1988,1987,1986,1985,1984,1983,1982,1981,1980,1979,1978,1977,1976,1975,1974,1973,1972,1971,1970,1969,1968,1967,1966,1965,1964,1963,1962,1961
Estas estadísticas en otros países:
AfghanistanAlbaniaAlgeriaAmerican SamoaAngolaAntigua and BarbudaArab WorldArgentinaArmeniaArubaAustraliaAustriaAzerbaijanBahamas, TheBahrainBangladeshBarbadosBelarusBelgiumBelizeBeninBermudaBoliviaBosnia and HerzegovinaBrazilBrunei DarussalamBulgariaBurkina FasoBurundiCabo VerdeCambodiaCameroonCanadaCaribbean small statesCentral African RepublicCentral Europe and the BalticsChadChileChinaColombiaComorosCongo, Dem. Rep.Congo, Rep.Costa RicaCote d'IvoireCroatiaCubaCyprusCzech RepublicDenmarkDjiboutiDominicaDominican RepublicEarly-demographic dividendEast Asia & PacificEast Asia & Pacific (excluding high income)East Asia & Pacific (IDA & IBRD countries)EcuadorEgypt, Arab Rep.El SalvadorEquatorial GuineaEstoniaEthiopiaEuro areaEurope & Central AsiaEurope & Central Asia (excluding high income)Europe & Central Asia (IDA & IBRD countries)European UnionFaroe IslandsFijiFinlandFragile and conflict affected situationsFranceFrench PolynesiaGabonGambia, TheGeorgiaGermanyGhanaGibraltarGreeceGreenlandGrenadaGuamGuatemalaGuineaGuinea-BissauGuyanaHaitiHeavily indebted poor countries (HIPC)High incomeHondurasHong Kong SAR, ChinaHungaryIBRD onlyIcelandIDA & IBRD totalIDA blendIDA onlyIDA totalIndiaIndonesiaIran, Islamic Rep.IraqIrelandIsraelItalyJamaicaJapanJordanKazakhstanKenyaKiribatiKorea, Dem. People’s Rep.Korea, Rep.KosovoKuwaitKyrgyz RepublicLao PDRLate-demographic dividendLatin America & Caribbean Latin America & Caribbean (excluding high income)Latin America & the Caribbean (IDA & IBRD countries)LatviaLeast developed countries: UN classificationLebanonLiberiaLibyaLithuaniaLow & middle incomeLow incomeLower middle incomeLuxembourgMacao SAR, ChinaMacedonia, FYRMadagascarMalawiMalaysiaMaldivesMaliMaltaMauritaniaMauritiusMexicoMiddle East & North AfricaMiddle East & North Africa (excluding high income)Middle East & North Africa (IDA & IBRD countries)Middle incomeMoldovaMongoliaMontenegroMoroccoMozambiqueMyanmarNauruNepalNetherlandsNew CaledoniaNew ZealandNicaraguaNigerNigeriaNorth AmericaNorwayOECD membersOmanOther small statesPacific island small statesPakistanPanamaPapua New GuineaParaguayPeruPhilippinesPolandPortugalPost-demographic dividendPre-demographic dividendQatarRomaniaRussian FederationRwandaSamoaSao Tome and PrincipeSaudi ArabiaSenegalSerbiaSeychellesSierra LeoneSingaporeSlovak RepublicSloveniaSmall statesSolomon IslandsSomaliaSouth AfricaSouth AsiaSouth Asia (IDA & IBRD)SpainSri LankaSt. Kitts and NevisSt. LuciaSt. Vincent and the GrenadinesSub-Saharan Africa Sub-Saharan Africa (excluding high income)Sub-Saharan Africa (IDA & IBRD countries)SudanSurinameSwedenSwitzerlandSyrian Arab RepublicTajikistanTanzaniaThailandTogoTongaTrinidad and TobagoTunisiaTurkeyTurkmenistanTuvaluUgandaUkraineUnited Arab EmiratesUnited KingdomUnited StatesUpper middle incomeUruguayUzbekistanVanuatuVenezuela, RBVietnamWorldYemen, Rep.ZambiaZimbabwe línea de tiempo (timeline):
En esta escala de tiempo se presenta un gráfico de 1961 y 2015 de Cameroon. Los datos de 1960 están ausentes. El número de observaciones reales por fecha: 55.
Fuente (nombre):
Indicadores del desarrollo mundial
Fuente (organización):
World Bank staff estimates based data from International Monetary Fund's Direction of Trade database.
Categorías:
Private Sector, Trade
Se ha actualizado:
23 abr 2017 año
Los indicadores de los cambios de valor en los últimos años
Mínimo:
58.365
1 ene 2012 año
Máximo:
92.778
1 ene 1964 año
A la fecha de observación
Valor
Cambio absoluto
El cambio con respecto al valor anterior
1 ene 1961 año
90.815
+90.815
0.0%
1 ene 1962 año
90.194
-0.621
-0.68%
1 ene 1963 año
89.782
-0.412
-0.46%
1 ene 1964 año
92.778
+2.997
3.34%
1 ene 1965 año
90.48
-2.298
-2.48%
1 ene 1966 año
91.139
+0.659
0.73%
1 ene 1967 año
86.28
-4.859
-5.33%
1 ene 1968 año
87.609
+1.329
1.54%
1 ene 1969 año
83.974
-3.635
-4.15%
1 ene 1970 año
84.653
+0.678
0.81%
1 ene 1971 año
86.58
+1.927
2.28%
1 ene 1972 año
83.242
-3.338
-3.86%
1 ene 1973 año
85.327
+2.085
2.51%
1 ene 1974 año
85.852
+0.525
0.62%
1 ene 1975 año
83.751
-2.101
-2.45%
1 ene 1976 año
73.567
-10.184
-12.16%
1 ene 1977 año
77.828
+4.261
5.79%
1 ene 1978 año
82.909
+5.08
6.53%
1 ene 1979 año
84.157
+1.248
1.51%
1 ene 1980 año
87.915
+3.758
4.47%
1 ene 1981 año
89.897
+1.982
2.25%
1 ene 1982 año
89.222
-0.675
-0.75%
1 ene 1983 año
89.584
+0.362
0.41%
1 ene 1984 año
84.932
-4.652
-5.19%
1 ene 1985 año
86.436
+1.504
1.77%
1 ene 1986 año
85.278
-1.158
-1.34%
1 ene 1987 año
77.32
-7.958
-9.33%
1 ene 1988 año
77.287
-0.033
-0.04%
1 ene 1989 año
86.614
+9.327
12.07%
1 ene 1990 año
63.326
-23.288
-26.89%
1 ene 1991 año
88.736
+25.41
40.13%
1 ene 1992 año
87.549
-1.187
-1.34%
1 ene 1993 año
81.896
-5.652
-6.46%
1 ene 1994 año
85.043
+3.147
3.84%
1 ene 1995 año
82.776
-2.267
-2.67%
1 ene 1996 año
84.418
+1.641
1.98%
1 ene 1997 año
84.096
-0.322
-0.38%
1 ene 1998 año
81.796
-2.3
-2.73%
1 ene 1999 año
83.098
+1.302
1.59%
1 ene 2000 año
81.816
-1.282
-1.54%
1 ene 2001 año
76.842
-4.974
-6.08%
1 ene 2002 año
79.072
+2.23
2.9%
1 ene 2003 año
77.62
-1.452
-1.84%
1 ene 2004 año
73.768
-3.852
-4.96%
1 ene 2005 año
81.152
+7.384
10.01%
1 ene 2006 año
82.277
+1.125
1.39%
1 ene 2007 año
83.115
+0.837
1.02%
1 ene 2008 año
81.289
-1.826
-2.2%
1 ene 2009 año
76.276
-5.013
-6.17%
1 ene 2010 año
68.622
-7.654
-10.03%
1 ene 2011 año
63.902
-4.72
-6.88%
1 ene 2012 año
58.365
-5.537
-8.66%
1 ene 2013 año
59.163
+0.798
1.37%
1 ene 2014 año
68.151
+8.988
15.19%
1 ene 2015 año
61.854
-6.297
-9.24%
Ranking de los países por los datos estadísticos actuales


Comentarios: