29
/es/
es
AIzaSyAYiBZKx7MnpbEhh9jyipgxe19OcubqV5w
April 1, 2024
185301
Madagascar
MDG
true
2
1
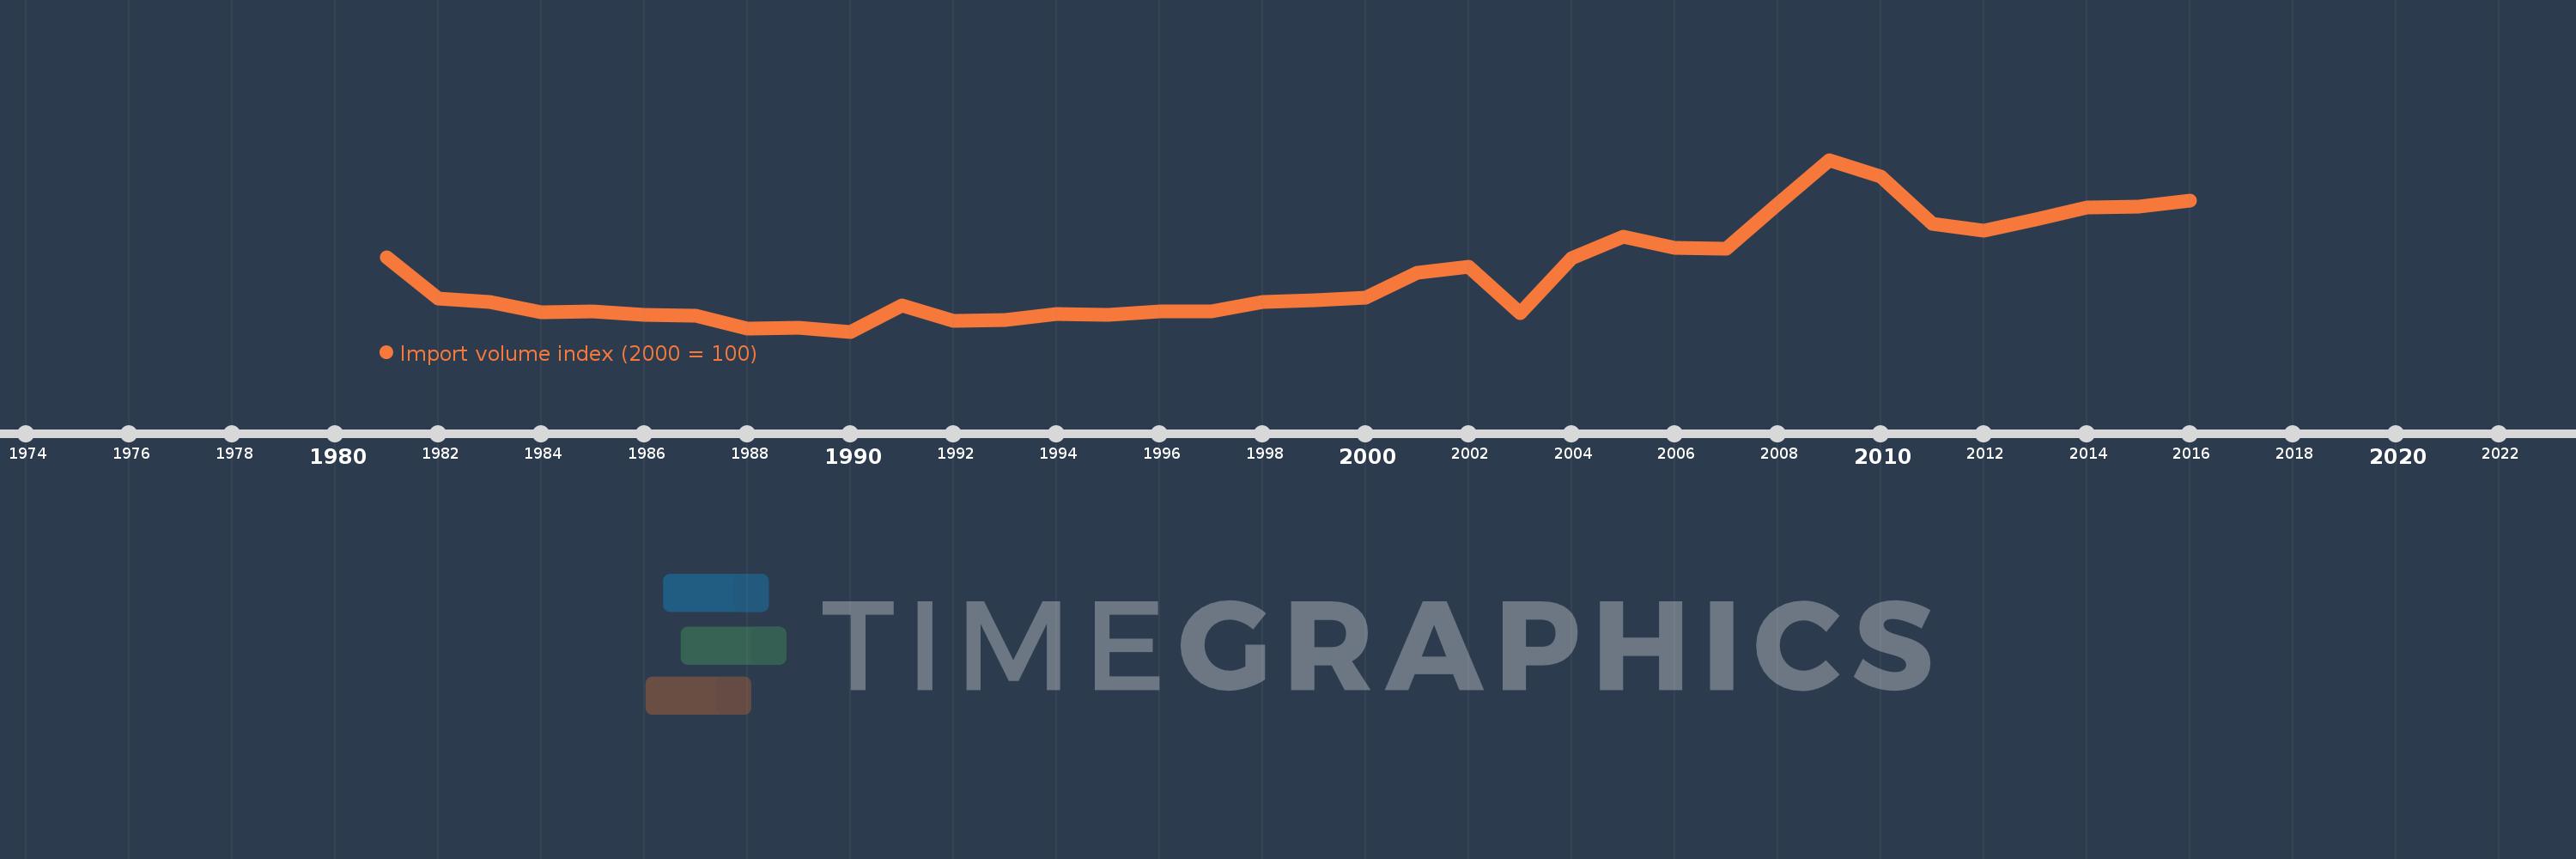
Import volume index (2000 = 100)
2016,2015,2014,2013,2012,2011,2010,2009,2008,2007,2006,2005,2004,2003,2002,2001,2000,1999,1998,1997,1996,1995,1994,1993,1992,1991,1990,1989,1988,1987,1986,1985,1984,1983,1982,1981
Estas estadísticas en otros países:
AfghanistanAlbaniaAlgeriaAmerican SamoaAndorraAngolaAntigua and BarbudaArgentinaArmeniaArubaAustraliaAustriaAzerbaijanBahamas, TheBahrainBangladeshBarbadosBelarusBelgiumBelizeBeninBermudaBhutanBoliviaBosnia and HerzegovinaBotswanaBrazilBritish Virgin IslandsBrunei DarussalamBulgariaBurkina FasoBurundiCabo VerdeCambodiaCameroonCanadaCayman IslandsCentral African RepublicChadChileChinaColombiaComorosCongo, Dem. Rep.Congo, Rep.Costa RicaCote d'IvoireCroatiaCubaCuracaoCyprusCzech RepublicDenmarkDjiboutiDominicaDominican RepublicEcuadorEgypt, Arab Rep.El SalvadorEquatorial GuineaEritreaEstoniaEthiopiaFaroe IslandsFijiFinlandFranceFrench PolynesiaGabonGambia, TheGeorgiaGermanyGhanaGibraltarGreeceGreenlandGrenadaGuamGuatemalaGuineaGuinea-BissauGuyanaHaitiHondurasHong Kong SAR, ChinaHungaryIcelandIndiaIndonesiaIran, Islamic Rep.IraqIrelandIsraelItalyJamaicaJapanJordanKazakhstanKenyaKiribatiKorea, Dem. People’s Rep.Korea, Rep.KuwaitKyrgyz RepublicLao PDRLatviaLebanonLesothoLiberiaLibyaLithuaniaLuxembourgMacao SAR, ChinaMacedonia, FYRMadagascarMalawiMalaysiaMaldivesMaliMaltaMarshall IslandsMauritaniaMauritiusMexicoMicronesia, Fed. Sts.MoldovaMongoliaMoroccoMozambiqueMyanmarNamibiaNauruNepalNetherlandsNew CaledoniaNew ZealandNicaraguaNigerNigeriaNorthern Mariana IslandsNorwayOmanPakistanPalauPanamaPapua New GuineaParaguayPeruPhilippinesPolandPortugalQatarRomaniaRussian FederationRwandaSamoaSao Tome and PrincipeSaudi ArabiaSenegalSerbiaSeychellesSierra LeoneSingaporeSlovak RepublicSloveniaSolomon IslandsSomaliaSouth AfricaSpainSri LankaSt. Kitts and NevisSt. LuciaSt. Vincent and the GrenadinesSudanSurinameSwazilandSwedenSwitzerlandSyrian Arab RepublicTajikistanTanzaniaThailandTogoTongaTrinidad and TobagoTunisiaTurkeyTurkmenistanTurks and Caicos IslandsUgandaUkraineUnited Arab EmiratesUnited KingdomUnited StatesUruguayUzbekistanVanuatuVenezuela, RBVietnamWest Bank and GazaYemen, Rep.ZambiaZimbabwe línea de tiempo (timeline):
En esta escala de tiempo se presenta un gráfico de 1981 y 2016 de Madagascar. Los datos de 1980 están ausentes. El número de observaciones reales por fecha: 36.
Fuente (nombre):
Indicadores del desarrollo mundial
Fuente (organización):
United Nations Conference on Trade and Development, Handbook of Statistics and data files, and International Monetary Fund, International Financial Statistics.
Categorías:
Private Sector, Trade
Se ha actualizado:
23 abr 2017 año
Los indicadores de los cambios de valor en los últimos años
Mínimo:
41.12
1 ene 1990 año
Máximo:
213.652
1 ene 2009 año
A la fecha de observación
Valor
Cambio absoluto
El cambio con respecto al valor anterior
1 ene 1981 año
116.12
+116.12
0.0%
1 ene 1982 año
74.218
-41.902
-36.09%
1 ene 1983 año
70.734
-3.485
-4.7%
1 ene 1984 año
60.194
-10.54
-14.9%
1 ene 1985 año
61.193
+0.999
1.66%
1 ene 1986 año
58.037
-3.156
-5.16%
1 ene 1987 año
57.228
-0.809
-1.39%
1 ene 1988 año
44.515
-12.713
-22.21%
1 ene 1989 año
44.994
+0.479
1.08%
1 ene 1990 año
41.12
-3.873
-8.61%
1 ene 1991 año
67.606
+26.486
64.41%
1 ene 1992 año
51.985
-15.621
-23.11%
1 ene 1993 año
52.443
+0.459
0.88%
1 ene 1994 año
58.604
+6.161
11.75%
1 ene 1995 año
58.209
-0.396
-0.68%
1 ene 1996 año
61.138
+2.929
5.03%
1 ene 1997 año
61.223
+0.085
0.14%
1 ene 1998 año
71.011
+9.788
15.99%
1 ene 1999 año
72.336
+1.325
1.87%
1 ene 2000 año
75.188
+2.852
3.94%
1 ene 2001 año
100.0
+24.812
33.0%
1 ene 2002 año
106.282
+6.282
6.28%
1 ene 2003 año
59.829
-46.453
-43.71%
1 ene 2004 año
114.849
+55.019
91.96%
1 ene 2005 año
136.175
+21.326
18.57%
1 ene 2006 año
125.613
-10.562
-7.76%
1 ene 2007 año
124.649
-0.963
-0.77%
1 ene 2008 año
169.209
+44.559
35.75%
1 ene 2009 año
213.652
+44.444
26.27%
1 ene 2010 año
196.906
-16.746
-7.84%
1 ene 2011 año
149.367
-47.538
-24.14%
1 ene 2012 año
142.494
-6.873
-4.6%
1 ene 2013 año
153.897
+11.403
8.0%
1 ene 2014 año
165.927
+12.03
7.82%
1 ene 2015 año
166.789
+0.862
0.52%
1 ene 2016 año
173.015
+6.226
3.73%
Ranking de los países por los datos estadísticos actuales


Comentarios: