29
/es/
es
AIzaSyAYiBZKx7MnpbEhh9jyipgxe19OcubqV5w
April 1, 2024
103721
Chad
TCD
true
2
1
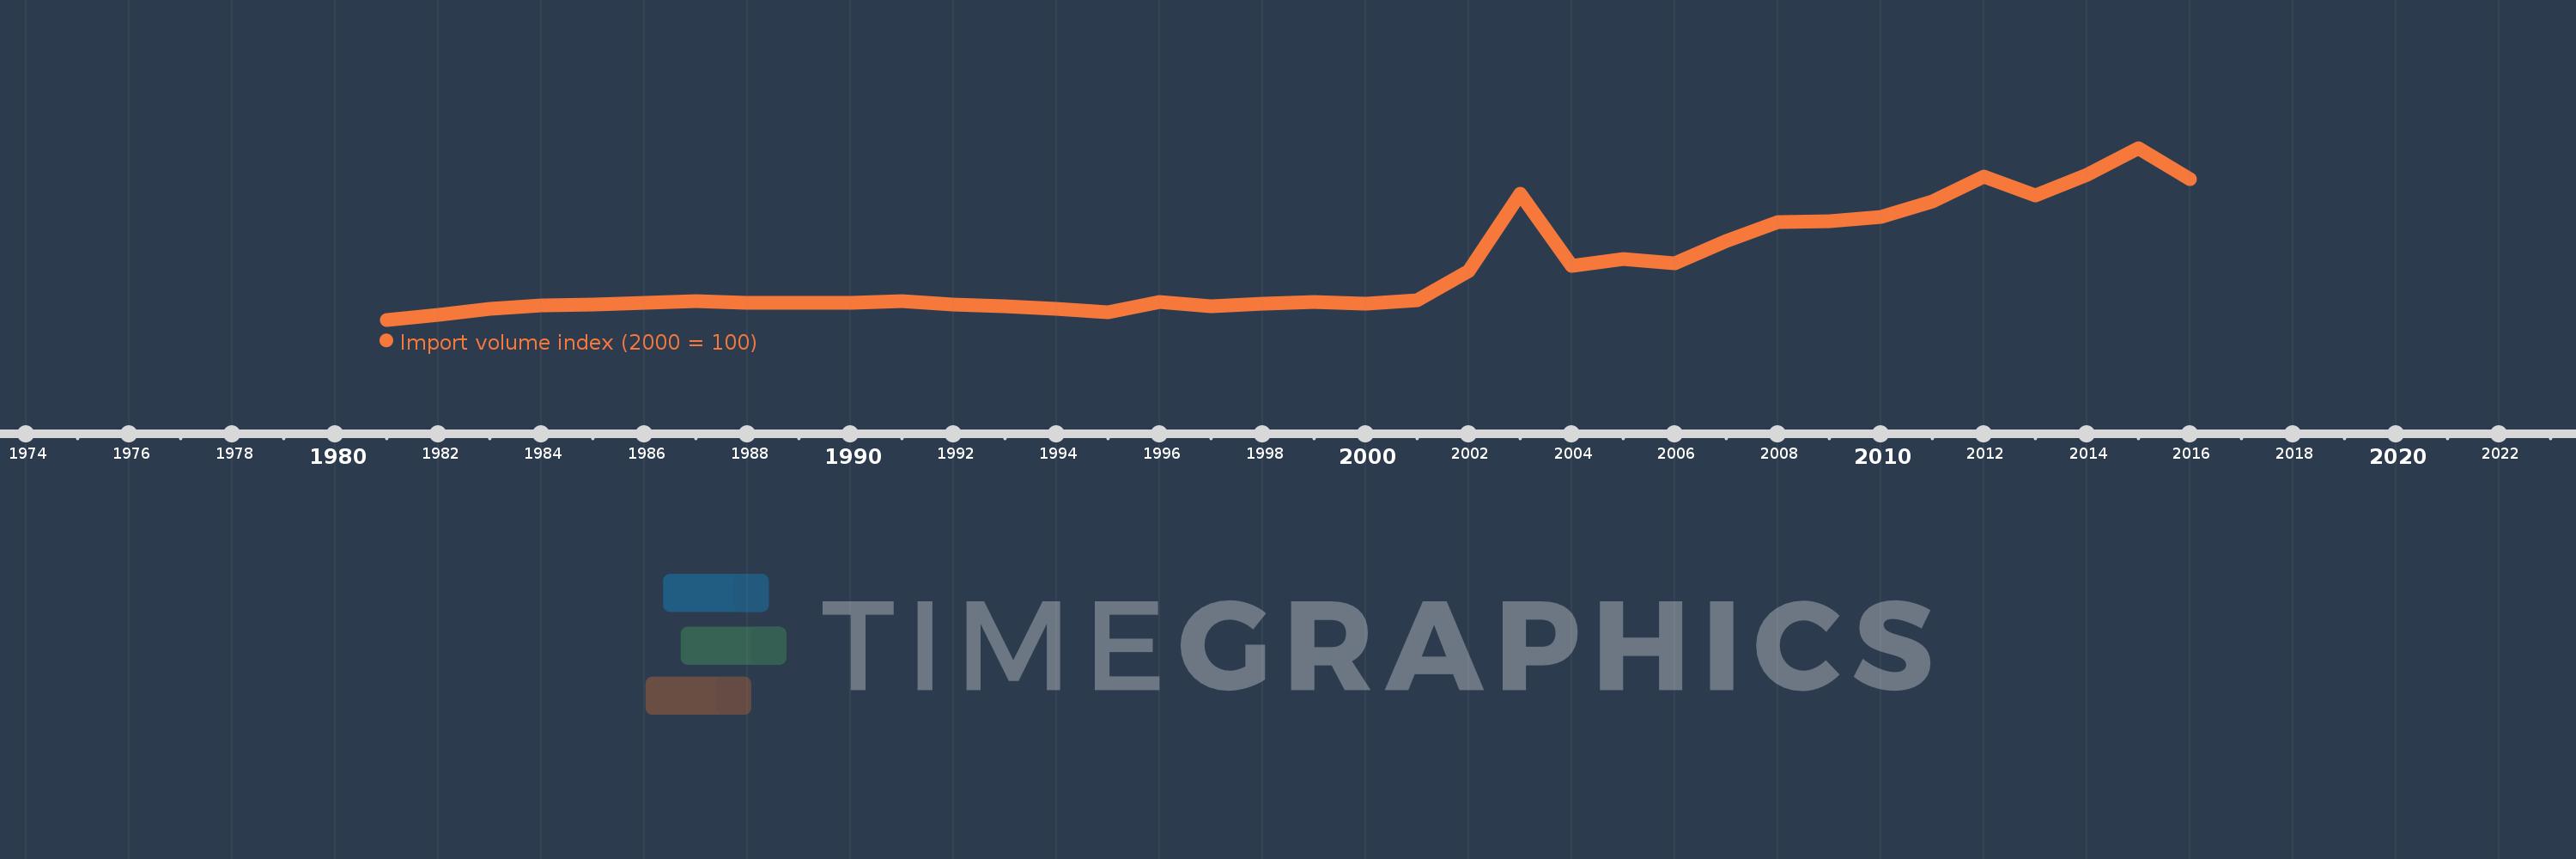
Import volume index (2000 = 100)
2016,2015,2014,2013,2012,2011,2010,2009,2008,2007,2006,2005,2004,2003,2002,2001,2000,1999,1998,1997,1996,1995,1994,1993,1992,1991,1990,1989,1988,1987,1986,1985,1984,1983,1982,1981
Estas estadísticas en otros países:
AfghanistanAlbaniaAlgeriaAmerican SamoaAndorraAngolaAntigua and BarbudaArgentinaArmeniaArubaAustraliaAustriaAzerbaijanBahamas, TheBahrainBangladeshBarbadosBelarusBelgiumBelizeBeninBermudaBhutanBoliviaBosnia and HerzegovinaBotswanaBrazilBritish Virgin IslandsBrunei DarussalamBulgariaBurkina FasoBurundiCabo VerdeCambodiaCameroonCanadaCayman IslandsCentral African RepublicChadChileChinaColombiaComorosCongo, Dem. Rep.Congo, Rep.Costa RicaCote d'IvoireCroatiaCubaCuracaoCyprusCzech RepublicDenmarkDjiboutiDominicaDominican RepublicEcuadorEgypt, Arab Rep.El SalvadorEquatorial GuineaEritreaEstoniaEthiopiaFaroe IslandsFijiFinlandFranceFrench PolynesiaGabonGambia, TheGeorgiaGermanyGhanaGibraltarGreeceGreenlandGrenadaGuamGuatemalaGuineaGuinea-BissauGuyanaHaitiHondurasHong Kong SAR, ChinaHungaryIcelandIndiaIndonesiaIran, Islamic Rep.IraqIrelandIsraelItalyJamaicaJapanJordanKazakhstanKenyaKiribatiKorea, Dem. People’s Rep.Korea, Rep.KuwaitKyrgyz RepublicLao PDRLatviaLebanonLesothoLiberiaLibyaLithuaniaLuxembourgMacao SAR, ChinaMacedonia, FYRMadagascarMalawiMalaysiaMaldivesMaliMaltaMarshall IslandsMauritaniaMauritiusMexicoMicronesia, Fed. Sts.MoldovaMongoliaMoroccoMozambiqueMyanmarNamibiaNauruNepalNetherlandsNew CaledoniaNew ZealandNicaraguaNigerNigeriaNorthern Mariana IslandsNorwayOmanPakistanPalauPanamaPapua New GuineaParaguayPeruPhilippinesPolandPortugalQatarRomaniaRussian FederationRwandaSamoaSao Tome and PrincipeSaudi ArabiaSenegalSerbiaSeychellesSierra LeoneSingaporeSlovak RepublicSloveniaSolomon IslandsSomaliaSouth AfricaSpainSri LankaSt. Kitts and NevisSt. LuciaSt. Vincent and the GrenadinesSudanSurinameSwazilandSwedenSwitzerlandSyrian Arab RepublicTajikistanTanzaniaThailandTogoTongaTrinidad and TobagoTunisiaTurkeyTurkmenistanTurks and Caicos IslandsUgandaUkraineUnited Arab EmiratesUnited KingdomUnited StatesUruguayUzbekistanVanuatuVenezuela, RBVietnamWest Bank and GazaYemen, Rep.ZambiaZimbabwe línea de tiempo (timeline):
En esta escala de tiempo se presenta un gráfico de 1981 y 2016 de Chad. Los datos de 1980 están ausentes. El número de observaciones reales por fecha: 36.
Fuente (nombre):
Indicadores del desarrollo mundial
Fuente (organización):
United Nations Conference on Trade and Development, Handbook of Statistics and data files, and International Monetary Fund, International Financial Statistics.
Categorías:
Private Sector, Trade
Se ha actualizado:
23 abr 2017 año
Los indicadores de los cambios de valor en los últimos años
Mínimo:
24.3
1 ene 1981 año
Máximo:
696.983
1 ene 2015 año
A la fecha de observación
Valor
Cambio absoluto
El cambio con respecto al valor anterior
1 ene 1981 año
24.3
+24.3
0.0%
1 ene 1982 año
41.794
+17.494
71.99%
1 ene 1983 año
66.294
+24.5
58.62%
1 ene 1984 año
78.915
+12.621
19.04%
1 ene 1985 año
84.653
+5.739
7.27%
1 ene 1986 año
90.973
+6.319
7.46%
1 ene 1987 año
98.951
+7.978
8.77%
1 ene 1988 año
89.602
-9.349
-9.45%
1 ene 1989 año
91.698
+2.096
2.34%
1 ene 1990 año
91.095
-0.602
-0.66%
1 ene 1991 año
97.421
+6.326
6.94%
1 ene 1992 año
83.469
-13.952
-14.32%
1 ene 1993 año
78.677
-4.791
-5.74%
1 ene 1994 año
67.841
-10.836
-13.77%
1 ene 1995 año
52.509
-15.333
-22.6%
1 ene 1996 año
95.04
+42.531
81.0%
1 ene 1997 año
77.985
-17.054
-17.94%
1 ene 1998 año
87.489
+9.504
12.19%
1 ene 1999 año
95.007
+7.517
8.59%
1 ene 2000 año
87.936
-7.07
-7.44%
1 ene 2001 año
100.0
+12.064
13.72%
1 ene 2002 año
215.678
+115.678
115.68%
1 ene 2003 año
519.284
+303.606
140.77%
1 ene 2004 año
234.97
-284.314
-54.75%
1 ene 2005 año
261.839
+26.87
11.44%
1 ene 2006 año
246.748
-15.091
-5.76%
1 ene 2007 año
334.12
+87.371
35.41%
1 ene 2008 año
406.474
+72.354
21.66%
1 ene 2009 año
409.159
+2.685
0.66%
1 ene 2010 año
427.676
+18.517
4.53%
1 ene 2011 año
486.684
+59.009
13.8%
1 ene 2012 año
586.401
+99.716
20.49%
1 ene 2013 año
511.071
-75.33
-12.85%
1 ene 2014 año
592.306
+81.234
15.89%
1 ene 2015 año
696.983
+104.677
17.67%
1 ene 2016 año
573.705
-123.278
-17.69%
Ranking de los países por los datos estadísticos actuales


Comentarios: