29
/es/
es
AIzaSyAYiBZKx7MnpbEhh9jyipgxe19OcubqV5w
April 1, 2024
185023
Madagascar
MDG
true
2
1
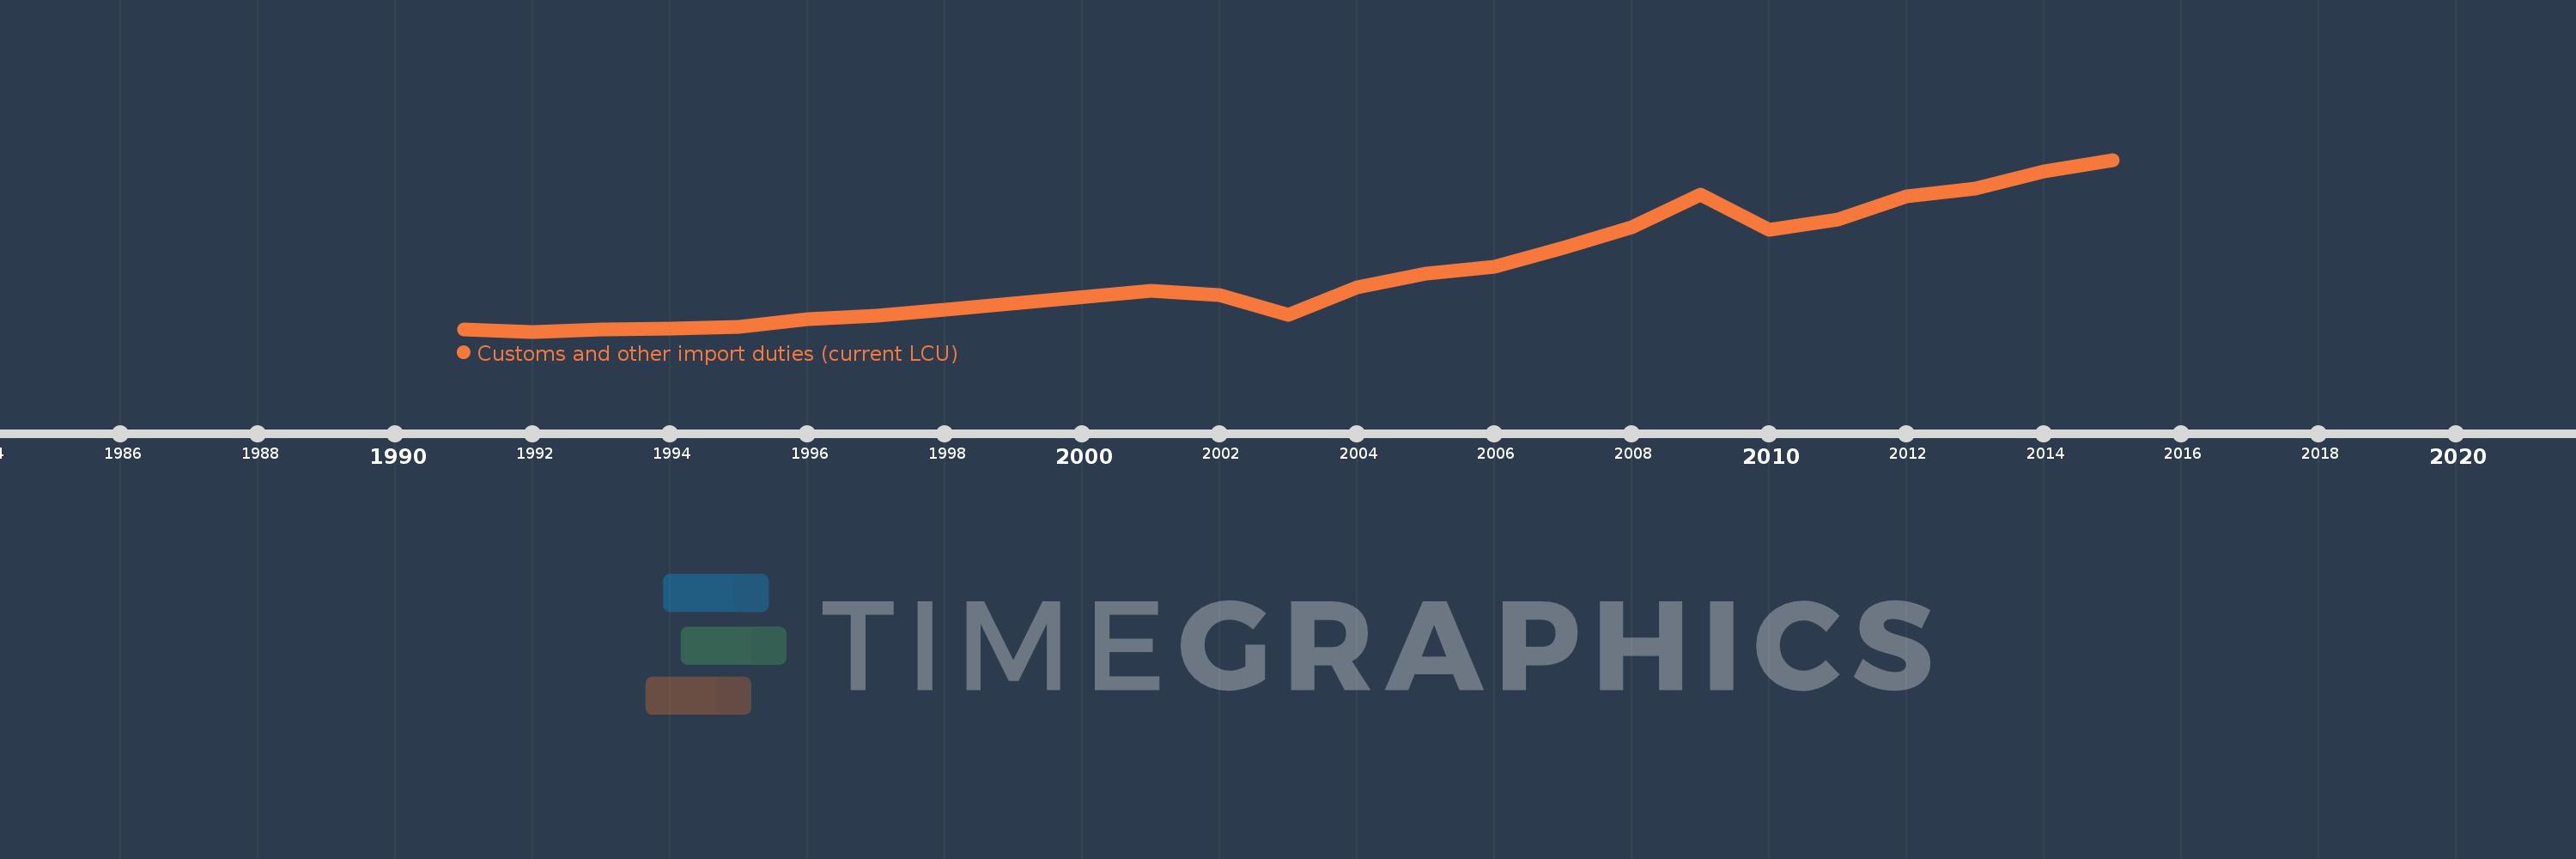
Customs and other import duties (current LCU)
2015,2014,2013,2012,2011,2010,2009,2008,2007,2006,2005,2004,2003,2002,2001,1998,1997,1996,1995,1994,1993,1992,1991
Estas estadísticas en otros países:
AfghanistanAlbaniaAlgeriaAngolaAntigua and BarbudaArgentinaArmeniaAustraliaAustriaAzerbaijanBahamas, TheBahrainBangladeshBarbadosBelarusBelizeBeninBhutanBoliviaBosnia and HerzegovinaBotswanaBrazilBulgariaBurkina FasoBurundiCabo VerdeCambodiaCentral African RepublicChileChinaColombiaCongo, Dem. Rep.Congo, Rep.Costa RicaCote d'IvoireCroatiaCyprusCzech RepublicDenmarkDominicaDominican RepublicEgypt, Arab Rep.El SalvadorEquatorial GuineaEstoniaEthiopiaFijiFinlandFranceGambia, TheGeorgiaGermanyGhanaGreeceGrenadaGuatemalaHondurasHong Kong SAR, ChinaHungaryIcelandIndiaIndonesiaIran, Islamic Rep.IraqIrelandIsraelItalyJamaicaJapanJordanKazakhstanKenyaKiribatiKorea, Rep.KuwaitKyrgyz RepublicLao PDRLatviaLebanonLiberiaLithuaniaLuxembourgMacedonia, FYRMadagascarMalawiMalaysiaMaldivesMaliMaltaMauritiusMexicoMicronesia, Fed. Sts.MoldovaMongoliaMoroccoMozambiqueMyanmarNamibiaNepalNetherlandsNew ZealandNicaraguaNorwayOmanPakistanPanamaPapua New GuineaParaguayPeruPhilippinesPolandPortugalQatarRomaniaRussian FederationRwandaSamoaSan MarinoSao Tome and PrincipeSenegalSerbiaSeychellesSierra LeoneSingaporeSlovak RepublicSloveniaSolomon IslandsSouth AfricaSpainSri LankaSt. Kitts and NevisSt. LuciaSurinameSwazilandSwedenSwitzerlandSyrian Arab RepublicTajikistanTanzaniaThailandTogoTrinidad and TobagoTunisiaTurkeyUgandaUkraineUnited Arab EmiratesUnited KingdomUnited StatesUruguayVanuatuVenezuela, RBVietnamWest Bank and GazaYemen, Rep.ZambiaZimbabwe línea de tiempo (timeline):
En esta escala de tiempo se presenta un gráfico de 1991 y 2015 de Madagascar. Los datos de 1990 están ausentes. El número de observaciones reales por fecha: 23.
Fuente (nombre):
Indicadores del desarrollo mundial
Fuente (organización):
International Monetary Fund, Government Finance Statistics Yearbook and data files.
Categorías:
Public Sector
Se ha actualizado:
23 abr 2017 año
Los indicadores de los cambios de valor en los últimos años
Mínimo:
30.12 bn
1 ene 1992 año
Máximo:
1.255 billones
1 ene 2015 año
A la fecha de observación
Valor
Cambio absoluto
El cambio con respecto al valor anterior
1 ene 1991 año
43.54 bn
+43.54 bn
0.0%
1 ene 1992 año
30.12 bn
-13.42 bn
-30.82%
1 ene 1993 año
44.48 bn
+14.36 bn
47.68%
1 ene 1994 año
51.12 bn
+6.64 bn
14.93%
1 ene 1995 año
64.0 bn
+12.88 bn
25.2%
1 ene 1996 año
117.96 bn
+53.96 bn
84.31%
1 ene 1997 año
146.32 bn
+28.36 bn
24.04%
1 ene 1998 año
188.18 bn
+41.86 bn
28.61%
1 ene 2001 año
318.18 bn
+130.0 bn
69.08%
1 ene 2002 año
290.42 bn
-27.76 bn
-8.72%
1 ene 2003 año
148.1 bn
-142.32 bn
-49.0%
1 ene 2004 año
342.632 bn
+194.532 bn
131.35%
1 ene 2005 año
444.917 bn
+102.284 bn
29.85%
1 ene 2006 año
491.0 bn
+46.083 bn
10.36%
1 ene 2007 año
628.9 bn
+137.9 bn
28.09%
1 ene 2008 año
774.459 bn
+145.559 bn
23.15%
1 ene 2009 año
1.007 billones
+232.941 bn
30.08%
1 ene 2010 año
753.432 bn
-253.968 bn
-25.21%
1 ene 2011 año
829.743 bn
+76.311 bn
10.13%
1 ene 2012 año
997.12 bn
+167.377 bn
20.17%
1 ene 2013 año
1.049 billones
+51.487 bn
5.16%
1 ene 2014 año
1.172 billones
+123.711 bn
11.8%
1 ene 2015 año
1.255 billones
+82.716 bn
7.06%
Ranking de los países por los datos estadísticos actuales


Comentarios: