29
/es/
es
AIzaSyAYiBZKx7MnpbEhh9jyipgxe19OcubqV5w
April 1, 2024
104710
Chile
CHL
true
2
1
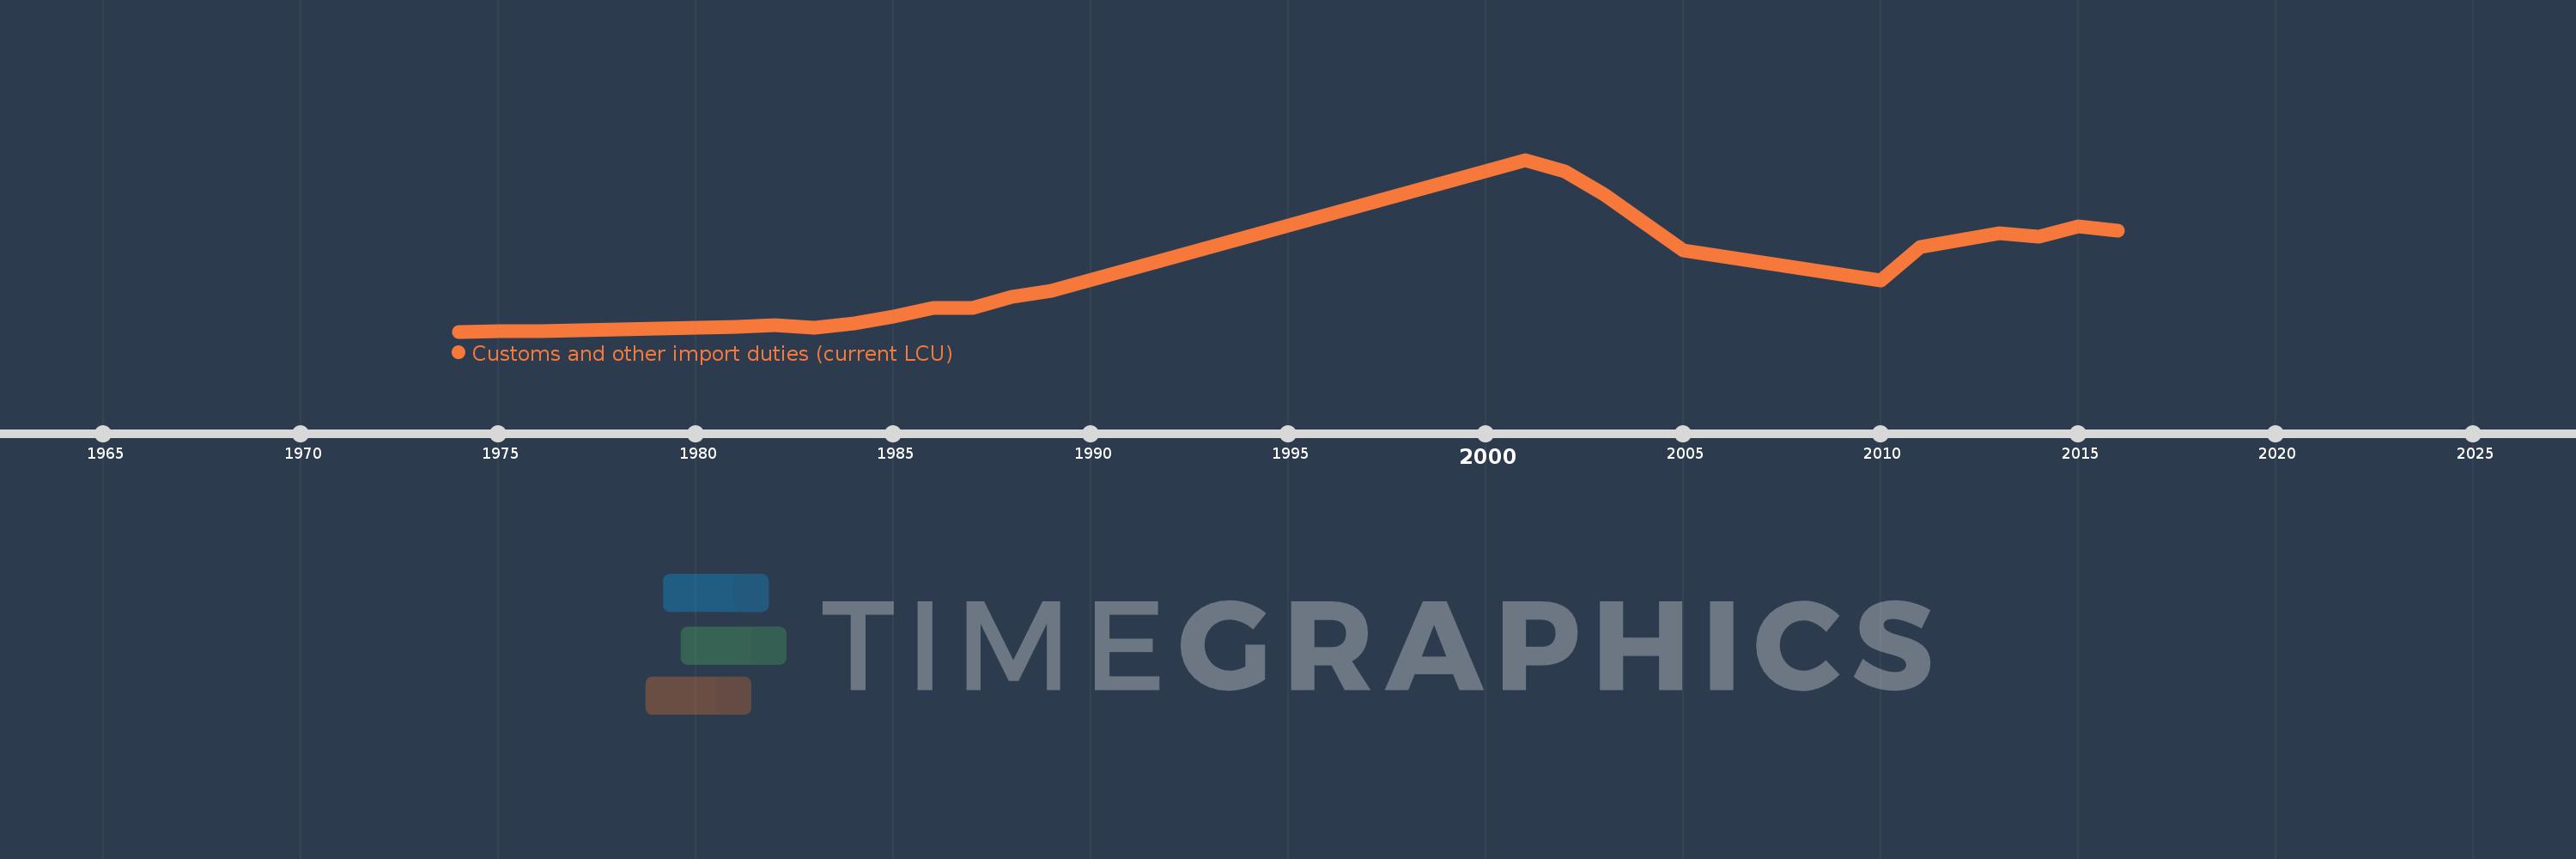
Customs and other import duties (current LCU)
2016,2015,2014,2013,2012,2011,2010,2005,2003,2002,2001,1989,1988,1987,1986,1985,1984,1983,1982,1981,1980,1979,1978,1977,1976,1975,1974
Estas estadísticas en otros países:
AfghanistanAlbaniaAlgeriaAngolaAntigua and BarbudaArgentinaArmeniaAustraliaAustriaAzerbaijanBahamas, TheBahrainBangladeshBarbadosBelarusBelizeBeninBhutanBoliviaBosnia and HerzegovinaBotswanaBrazilBulgariaBurkina FasoBurundiCabo VerdeCambodiaCentral African RepublicChileChinaColombiaCongo, Dem. Rep.Congo, Rep.Costa RicaCote d'IvoireCroatiaCyprusCzech RepublicDenmarkDominicaDominican RepublicEgypt, Arab Rep.El SalvadorEquatorial GuineaEstoniaEthiopiaFijiFinlandFranceGambia, TheGeorgiaGermanyGhanaGreeceGrenadaGuatemalaHondurasHong Kong SAR, ChinaHungaryIcelandIndiaIndonesiaIran, Islamic Rep.IraqIrelandIsraelItalyJamaicaJapanJordanKazakhstanKenyaKiribatiKorea, Rep.KuwaitKyrgyz RepublicLao PDRLatviaLebanonLiberiaLithuaniaLuxembourgMacedonia, FYRMadagascarMalawiMalaysiaMaldivesMaliMaltaMauritiusMexicoMicronesia, Fed. Sts.MoldovaMongoliaMoroccoMozambiqueMyanmarNamibiaNepalNetherlandsNew ZealandNicaraguaNorwayOmanPakistanPanamaPapua New GuineaParaguayPeruPhilippinesPolandPortugalQatarRomaniaRussian FederationRwandaSamoaSan MarinoSao Tome and PrincipeSenegalSerbiaSeychellesSierra LeoneSingaporeSlovak RepublicSloveniaSolomon IslandsSouth AfricaSpainSri LankaSt. Kitts and NevisSt. LuciaSurinameSwazilandSwedenSwitzerlandSyrian Arab RepublicTajikistanTanzaniaThailandTogoTrinidad and TobagoTunisiaTurkeyUgandaUkraineUnited Arab EmiratesUnited KingdomUnited StatesUruguayVanuatuVenezuela, RBVietnamWest Bank and GazaYemen, Rep.ZambiaZimbabwe línea de tiempo (timeline):
En esta escala de tiempo se presenta un gráfico de 1974 y 2016 de Chile. Los datos de 1973 están ausentes. El número de observaciones reales por fecha: 27.
Fuente (nombre):
Indicadores del desarrollo mundial
Fuente (organización):
International Monetary Fund, Government Finance Statistics Yearbook and data files.
Categorías:
Public Sector
Se ha actualizado:
23 abr 2017 año
Los indicadores de los cambios de valor en los últimos años
Mínimo:
40.0 millones
1 ene 1974 año
Máximo:
548.57 bn
1 ene 2001 año
A la fecha de observación
Valor
Cambio absoluto
El cambio con respecto al valor anterior
1 ene 1974 año
40.0 millones
+40.0 millones
0.0%
1 ene 1975 año
180.0 millones
+140.0 millones
350.0%
1 ene 1976 año
1.04 bn
+860.0 millones
477.78%
1 ene 1977 año
2.92 bn
+1.88 bn
180.77%
1 ene 1978 año
6.79 bn
+3.87 bn
132.53%
1 ene 1979 año
9.64 bn
+2.85 bn
41.97%
1 ene 1980 año
11.25 bn
+1.61 bn
16.7%
1 ene 1981 año
14.92 bn
+3.67 bn
32.62%
1 ene 1982 año
21.37 bn
+6.45 bn
43.23%
1 ene 1983 año
13.12 bn
-8.25 bn
-38.61%
1 ene 1984 año
25.59 bn
+12.47 bn
95.05%
1 ene 1985 año
49.14 bn
+23.55 bn
92.03%
1 ene 1986 año
76.29 bn
+27.15 bn
55.25%
1 ene 1987 año
75.09 bn
-1.2 bn
-1.57%
1 ene 1988 año
112.01 bn
+36.92 bn
49.17%
1 ene 1989 año
129.17 bn
+17.16 bn
15.32%
1 ene 2001 año
548.57 bn
+419.4 bn
324.69%
1 ene 2002 año
510.24 bn
-38.33 bn
-6.99%
1 ene 2003 año
436.6 bn
-73.64 bn
-14.43%
1 ene 2005 año
259.95 bn
-176.65 bn
-40.46%
1 ene 2010 año
162.987 bn
-96.963 bn
-37.3%
1 ene 2011 año
269.087 bn
+106.1 bn
65.1%
1 ene 2012 año
292.936 bn
+23.849 bn
8.86%
1 ene 2013 año
313.032 bn
+20.096 bn
6.86%
1 ene 2014 año
302.78 bn
-10.252 bn
-3.28%
1 ene 2015 año
337.138 bn
+34.358 bn
11.35%
1 ene 2016 año
323.485 bn
-13.653 bn
-4.05%
Ranking de los países por los datos estadísticos actuales


Comentarios: