29
/es/
es
AIzaSyAYiBZKx7MnpbEhh9jyipgxe19OcubqV5w
April 1, 2024
182539
Luxembourg
LUX
true
2
1
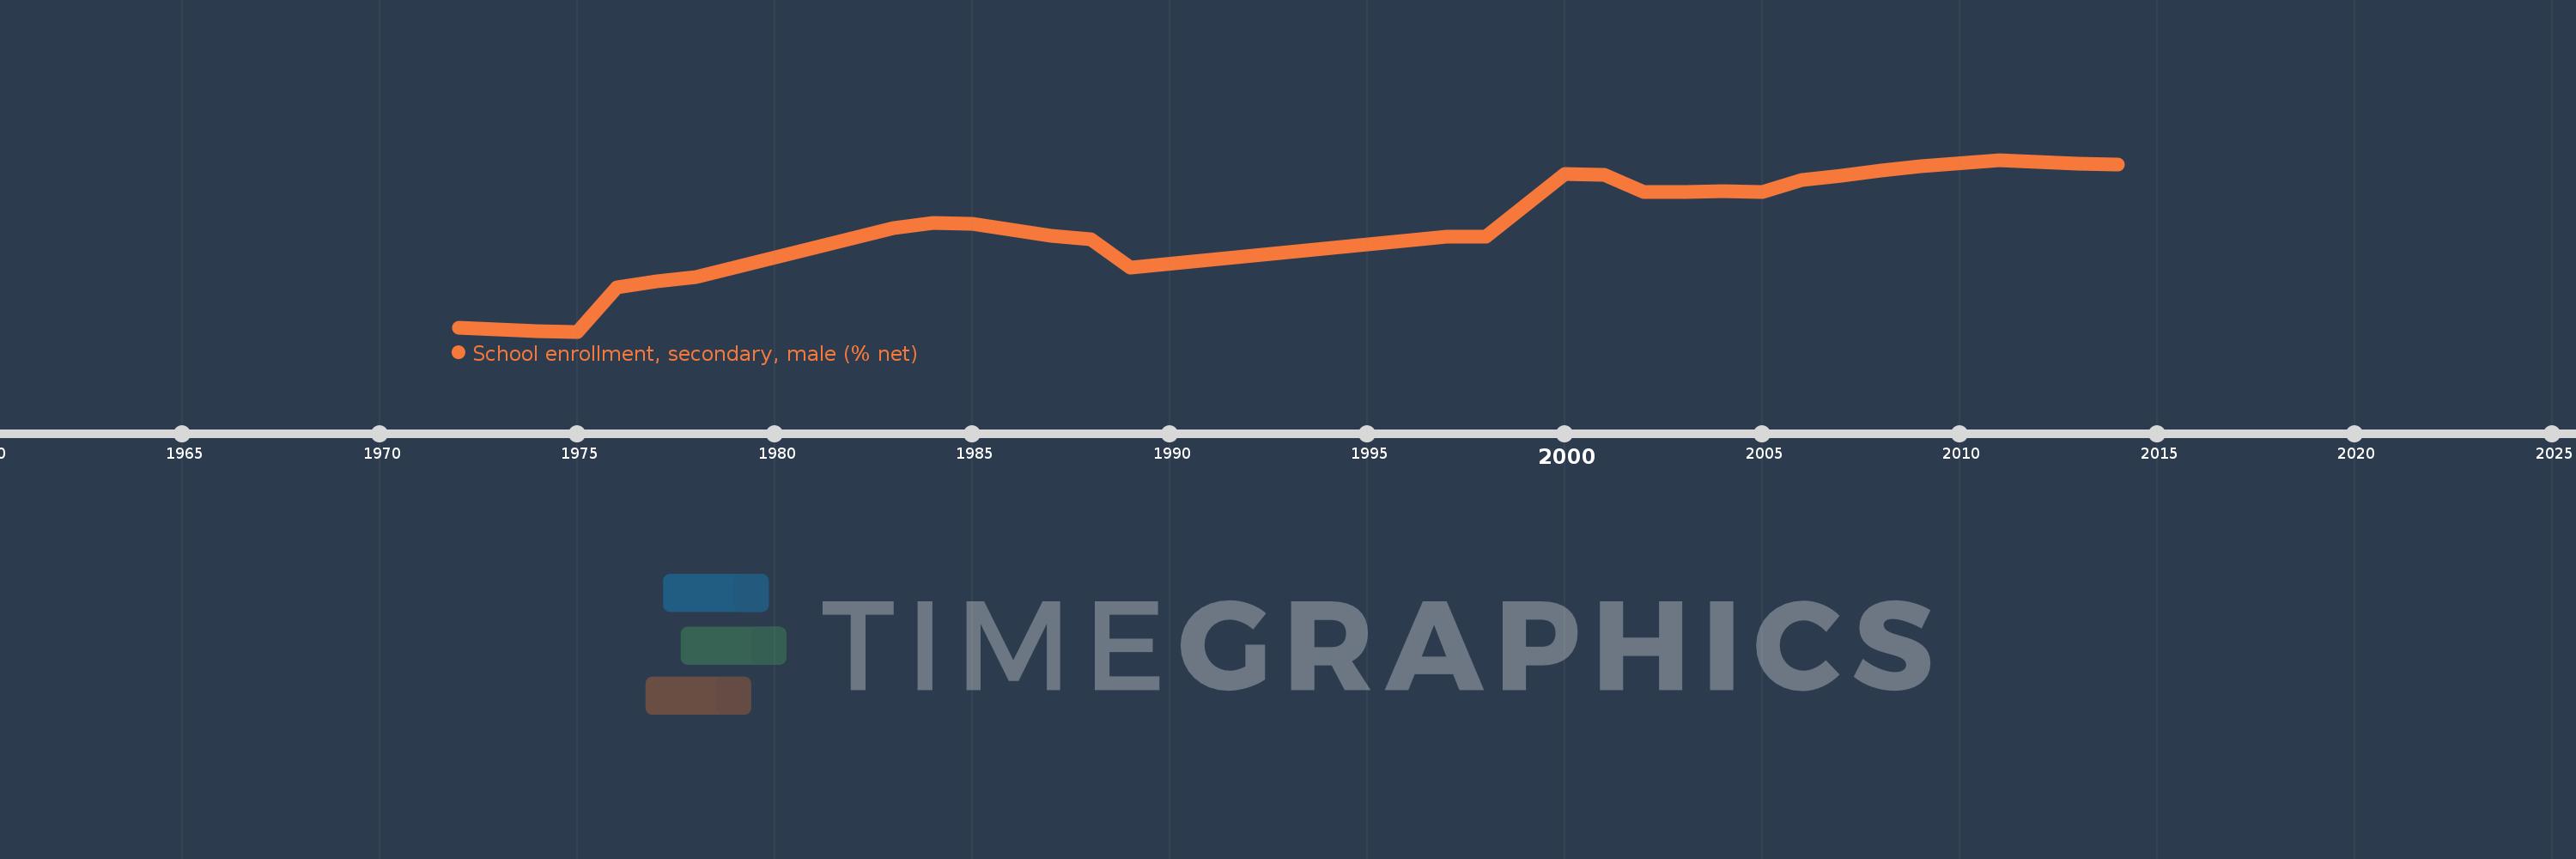
School enrollment, secondary, male (% net)
2014,2013,2012,2011,2009,2008,2007,2006,2005,2004,2003,2002,2001,2000,1998,1997,1989,1988,1987,1985,1984,1983,1978,1977,1976,1975,1974,1973,1972
Estas estadísticas en otros países:
AfghanistanAlbaniaAlgeriaAngolaAntigua and BarbudaArab WorldArgentinaArmeniaArubaAustraliaAzerbaijanBahamas, TheBahrainBangladeshBarbadosBelarusBelgiumBelizeBeninBermudaBhutanBoliviaBotswanaBrazilBrunei DarussalamBulgariaBurkina FasoBurundiCabo VerdeCambodiaCameroonCanadaCaribbean small statesCentral African RepublicCentral Europe and the BalticsChadChileColombiaComorosCongo, Dem. Rep.Congo, Rep.Costa RicaCroatiaCubaCyprusDenmarkDjiboutiDominicaDominican RepublicEarly-demographic dividendEast Asia & PacificEast Asia & Pacific (excluding high income)East Asia & Pacific (IDA & IBRD countries)EcuadorEgypt, Arab Rep.El SalvadorEquatorial GuineaEritreaEstoniaEthiopiaEuro areaEurope & Central AsiaEurope & Central Asia (excluding high income)Europe & Central Asia (IDA & IBRD countries)European UnionFijiFinlandFragile and conflict affected situationsFranceGambia, TheGeorgiaGhanaGreeceGrenadaGuatemalaGuineaGuinea-BissauGuyanaHeavily indebted poor countries (HIPC)High incomeHondurasHong Kong SAR, ChinaHungaryIBRD onlyIcelandIDA & IBRD totalIDA blendIDA onlyIDA totalIndiaIndonesiaIran, Islamic Rep.IraqIrelandIsraelItalyJamaicaJapanJordanKazakhstanKenyaKiribatiKorea, Rep.KuwaitKyrgyz RepublicLao PDRLate-demographic dividendLatin America & Caribbean Latin America & Caribbean (excluding high income)Latin America & the Caribbean (IDA & IBRD countries)LatviaLeast developed countries: UN classificationLebanonLesothoLibyaLiechtensteinLithuaniaLow & middle incomeLow incomeLower middle incomeLuxembourgMacao SAR, ChinaMacedonia, FYRMadagascarMalawiMaldivesMaliMaltaMarshall IslandsMauritaniaMauritiusMexicoMiddle East & North AfricaMiddle East & North Africa (excluding high income)Middle East & North Africa (IDA & IBRD countries)Middle incomeMoldovaMongoliaMoroccoMozambiqueMyanmarNamibiaNauruNepalNetherlandsNew ZealandNicaraguaNigerNorth AmericaNorwayOECD membersOmanOther small statesPacific island small statesPakistanPanamaParaguayPeruPhilippinesPolandPortugalPost-demographic dividendPre-demographic dividendPuerto RicoQatarRomaniaSamoaSao Tome and PrincipeSaudi ArabiaSenegalSerbiaSeychellesSierra LeoneSloveniaSmall statesSolomon IslandsSomaliaSouth AfricaSouth AsiaSouth Asia (IDA & IBRD)SpainSri LankaSt. Kitts and NevisSt. LuciaSt. Vincent and the GrenadinesSub-Saharan Africa Sub-Saharan Africa (excluding high income)Sub-Saharan Africa (IDA & IBRD countries)SurinameSwazilandSwedenSwitzerlandSyrian Arab RepublicTajikistanThailandTimor-LesteTogoTongaTrinidad and TobagoTunisiaTurkeyTuvaluUgandaUkraineUnited Arab EmiratesUnited KingdomUnited StatesUpper middle incomeUruguayVanuatuVenezuela, RBWest Bank and GazaWorldYemen, Rep.Zimbabwe línea de tiempo (timeline):
En esta escala de tiempo se presenta un gráfico de 1972 y 2014 de Luxembourg. Los datos de 1971 están ausentes. El número de observaciones reales por fecha: 29.
Fuente (nombre):
Indicadores del desarrollo mundial
Fuente (organización):
United Nations Educational, Scientific, and Cultural Organization (UNESCO) Institute for Statistics.
Categorías:
Education, Gender
Se ha actualizado:
23 abr 2017 año
Los indicadores de los cambios de valor en los últimos años
Mínimo:
43.84
1 ene 1975 año
Máximo:
85.219
1 ene 2011 año
A la fecha de observación
Valor
Cambio absoluto
El cambio con respecto al valor anterior
1 ene 1972 año
44.781
+44.781
0.0%
1 ene 1973 año
44.365
-0.416
-0.93%
1 ene 1974 año
43.94
-0.425
-0.96%
1 ene 1975 año
43.84
-0.1
-0.23%
1 ene 1976 año
54.468
+10.628
24.24%
1 ene 1977 año
55.88
+1.412
2.59%
1 ene 1978 año
56.945
+1.064
1.9%
1 ene 1983 año
68.795
+11.851
20.81%
1 ene 1984 año
69.924
+1.128
1.64%
1 ene 1985 año
69.72
-0.204
-0.29%
1 ene 1987 año
66.977
-2.743
-3.93%
1 ene 1988 año
66.091
-0.887
-1.32%
1 ene 1989 año
59.309
-6.782
-10.26%
1 ene 1997 año
66.746
+7.437
12.54%
1 ene 1998 año
66.622
-0.124
-0.19%
1 ene 2000 año
81.713
+15.092
22.65%
1 ene 2001 año
81.528
-0.185
-0.23%
1 ene 2002 año
77.525
-4.003
-4.91%
1 ene 2003 año
77.398
-0.127
-0.16%
1 ene 2004 año
77.696
+0.298
0.39%
1 ene 2005 año
77.388
-0.308
-0.4%
1 ene 2006 año
80.405
+3.017
3.9%
1 ene 2007 año
81.485
+1.08
1.34%
1 ene 2008 año
82.576
+1.09
1.34%
1 ene 2009 año
83.729
+1.153
1.4%
1 ene 2011 año
85.219
+1.49
1.78%
1 ene 2012 año
84.735
-0.484
-0.57%
1 ene 2013 año
84.185
-0.55
-0.65%
1 ene 2014 año
84.036
-0.149
-0.18%
Ranking de los países por los datos estadísticos actuales


Comentarios: