29
/es/
es
AIzaSyAYiBZKx7MnpbEhh9jyipgxe19OcubqV5w
April 1, 2024
142306
Greece
GRC
true
2
1
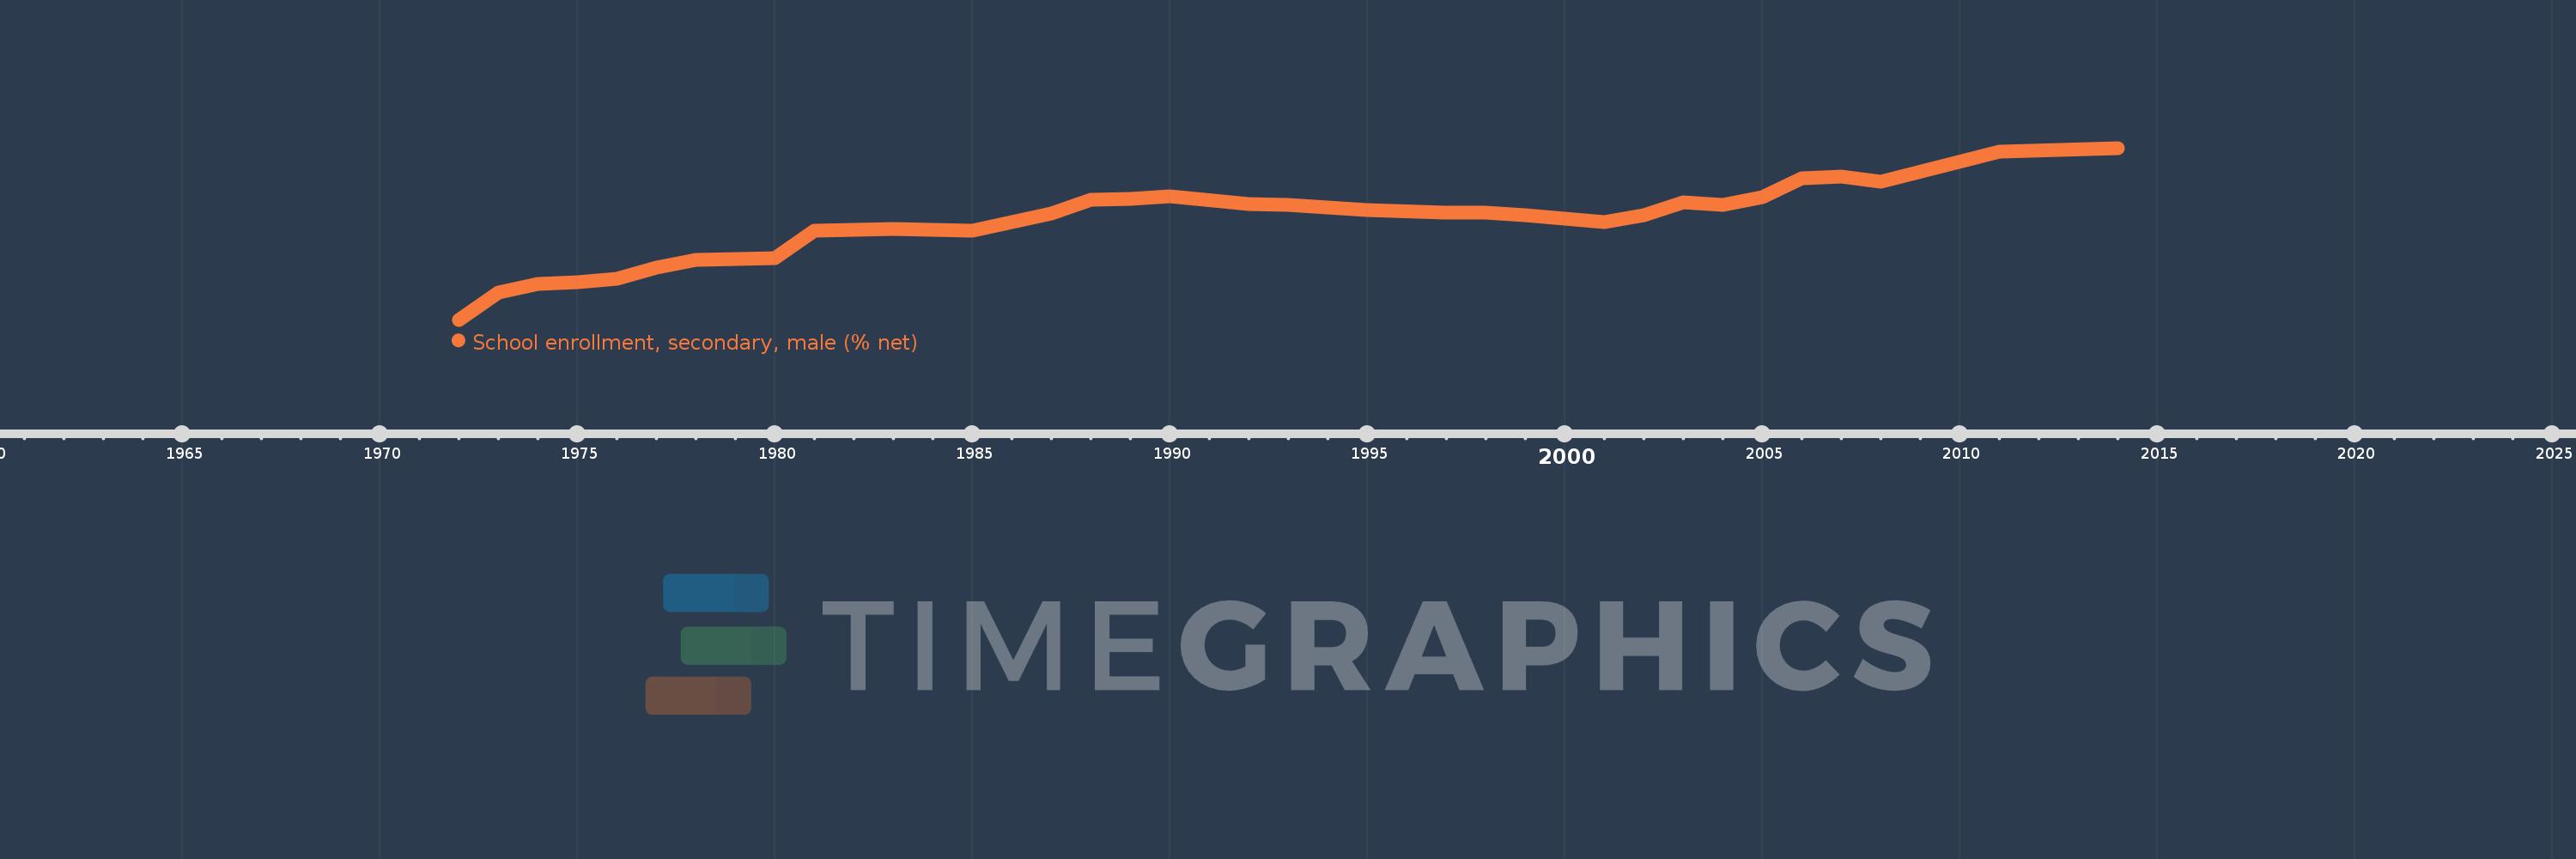
School enrollment, secondary, male (% net)
2014,2011,2008,2007,2006,2005,2004,2003,2002,2001,2000,1999,1998,1997,1995,1993,1992,1990,1989,1988,1987,1986,1985,1983,1981,1980,1979,1978,1977,1976,1975,1974,1973,1972
Estas estadísticas en otros países:
AfghanistanAlbaniaAlgeriaAngolaAntigua and BarbudaArab WorldArgentinaArmeniaArubaAustraliaAzerbaijanBahamas, TheBahrainBangladeshBarbadosBelarusBelgiumBelizeBeninBermudaBhutanBoliviaBotswanaBrazilBrunei DarussalamBulgariaBurkina FasoBurundiCabo VerdeCambodiaCameroonCanadaCaribbean small statesCentral African RepublicCentral Europe and the BalticsChadChileColombiaComorosCongo, Dem. Rep.Congo, Rep.Costa RicaCroatiaCubaCyprusDenmarkDjiboutiDominicaDominican RepublicEarly-demographic dividendEast Asia & PacificEast Asia & Pacific (excluding high income)East Asia & Pacific (IDA & IBRD countries)EcuadorEgypt, Arab Rep.El SalvadorEquatorial GuineaEritreaEstoniaEthiopiaEuro areaEurope & Central AsiaEurope & Central Asia (excluding high income)Europe & Central Asia (IDA & IBRD countries)European UnionFijiFinlandFragile and conflict affected situationsFranceGambia, TheGeorgiaGhanaGreeceGrenadaGuatemalaGuineaGuinea-BissauGuyanaHeavily indebted poor countries (HIPC)High incomeHondurasHong Kong SAR, ChinaHungaryIBRD onlyIcelandIDA & IBRD totalIDA blendIDA onlyIDA totalIndiaIndonesiaIran, Islamic Rep.IraqIrelandIsraelItalyJamaicaJapanJordanKazakhstanKenyaKiribatiKorea, Rep.KuwaitKyrgyz RepublicLao PDRLate-demographic dividendLatin America & Caribbean Latin America & Caribbean (excluding high income)Latin America & the Caribbean (IDA & IBRD countries)LatviaLeast developed countries: UN classificationLebanonLesothoLibyaLiechtensteinLithuaniaLow & middle incomeLow incomeLower middle incomeLuxembourgMacao SAR, ChinaMacedonia, FYRMadagascarMalawiMaldivesMaliMaltaMarshall IslandsMauritaniaMauritiusMexicoMiddle East & North AfricaMiddle East & North Africa (excluding high income)Middle East & North Africa (IDA & IBRD countries)Middle incomeMoldovaMongoliaMoroccoMozambiqueMyanmarNamibiaNauruNepalNetherlandsNew ZealandNicaraguaNigerNorth AmericaNorwayOECD membersOmanOther small statesPacific island small statesPakistanPanamaParaguayPeruPhilippinesPolandPortugalPost-demographic dividendPre-demographic dividendPuerto RicoQatarRomaniaSamoaSao Tome and PrincipeSaudi ArabiaSenegalSerbiaSeychellesSierra LeoneSloveniaSmall statesSolomon IslandsSomaliaSouth AfricaSouth AsiaSouth Asia (IDA & IBRD)SpainSri LankaSt. Kitts and NevisSt. LuciaSt. Vincent and the GrenadinesSub-Saharan Africa Sub-Saharan Africa (excluding high income)Sub-Saharan Africa (IDA & IBRD countries)SurinameSwazilandSwedenSwitzerlandSyrian Arab RepublicTajikistanThailandTimor-LesteTogoTongaTrinidad and TobagoTunisiaTurkeyTuvaluUgandaUkraineUnited Arab EmiratesUnited KingdomUnited StatesUpper middle incomeUruguayVanuatuVenezuela, RBWest Bank and GazaWorldYemen, Rep.Zimbabwe línea de tiempo (timeline):
En esta escala de tiempo se presenta un gráfico de 1972 y 2014 de Greece. Los datos de 1971 están ausentes. El número de observaciones reales por fecha: 34.
Fuente (nombre):
Indicadores del desarrollo mundial
Fuente (organización):
United Nations Educational, Scientific, and Cultural Organization (UNESCO) Institute for Statistics.
Categorías:
Education, Gender
Se ha actualizado:
23 abr 2017 año
Los indicadores de los cambios de valor en los últimos años
Mínimo:
55.767
1 ene 1972 año
Máximo:
95.963
1 ene 2014 año
A la fecha de observación
Valor
Cambio absoluto
El cambio con respecto al valor anterior
1 ene 1972 año
55.767
+55.767
0.0%
1 ene 1973 año
62.123
+6.356
11.4%
1 ene 1974 año
64.129
+2.005
3.23%
1 ene 1975 año
64.642
+0.514
0.8%
1 ene 1976 año
65.316
+0.673
1.04%
1 ene 1977 año
67.881
+2.565
3.93%
1 ene 1978 año
69.72
+1.839
2.71%
1 ene 1979 año
69.91
+0.19
0.27%
1 ene 1980 año
70.081
+0.171
0.24%
1 ene 1981 año
76.615
+6.534
9.32%
1 ene 1983 año
76.995
+0.379
0.5%
1 ene 1985 año
76.645
-0.35
-0.45%
1 ene 1986 año
78.519
+1.873
2.44%
1 ene 1987 año
80.626
+2.108
2.68%
1 ene 1988 año
83.913
+3.287
4.08%
1 ene 1989 año
84.043
+0.13
0.15%
1 ene 1990 año
84.739
+0.696
0.83%
1 ene 1992 año
82.875
-1.864
-2.2%
1 ene 1993 año
82.709
-0.166
-0.2%
1 ene 1995 año
81.362
-1.348
-1.63%
1 ene 1997 año
80.811
-0.55
-0.68%
1 ene 1998 año
80.839
+0.028
0.03%
1 ene 1999 año
80.314
-0.525
-0.65%
1 ene 2000 año
79.481
-0.833
-1.04%
1 ene 2001 año
78.604
-0.877
-1.1%
1 ene 2002 año
80.25
+1.646
2.09%
1 ene 2003 año
83.261
+3.011
3.75%
1 ene 2004 año
82.545
-0.715
-0.86%
1 ene 2005 año
84.41
+1.865
2.26%
1 ene 2006 año
88.862
+4.452
5.27%
1 ene 2007 año
89.354
+0.492
0.55%
1 ene 2008 año
87.974
-1.38
-1.54%
1 ene 2011 año
95.051
+7.077
8.04%
1 ene 2014 año
95.963
+0.912
0.96%
Ranking de los países por los datos estadísticos actuales


Comentarios: