29
/es/
es
AIzaSyAYiBZKx7MnpbEhh9jyipgxe19OcubqV5w
April 1, 2024
171730
Kuwait
KWT
true
2
1
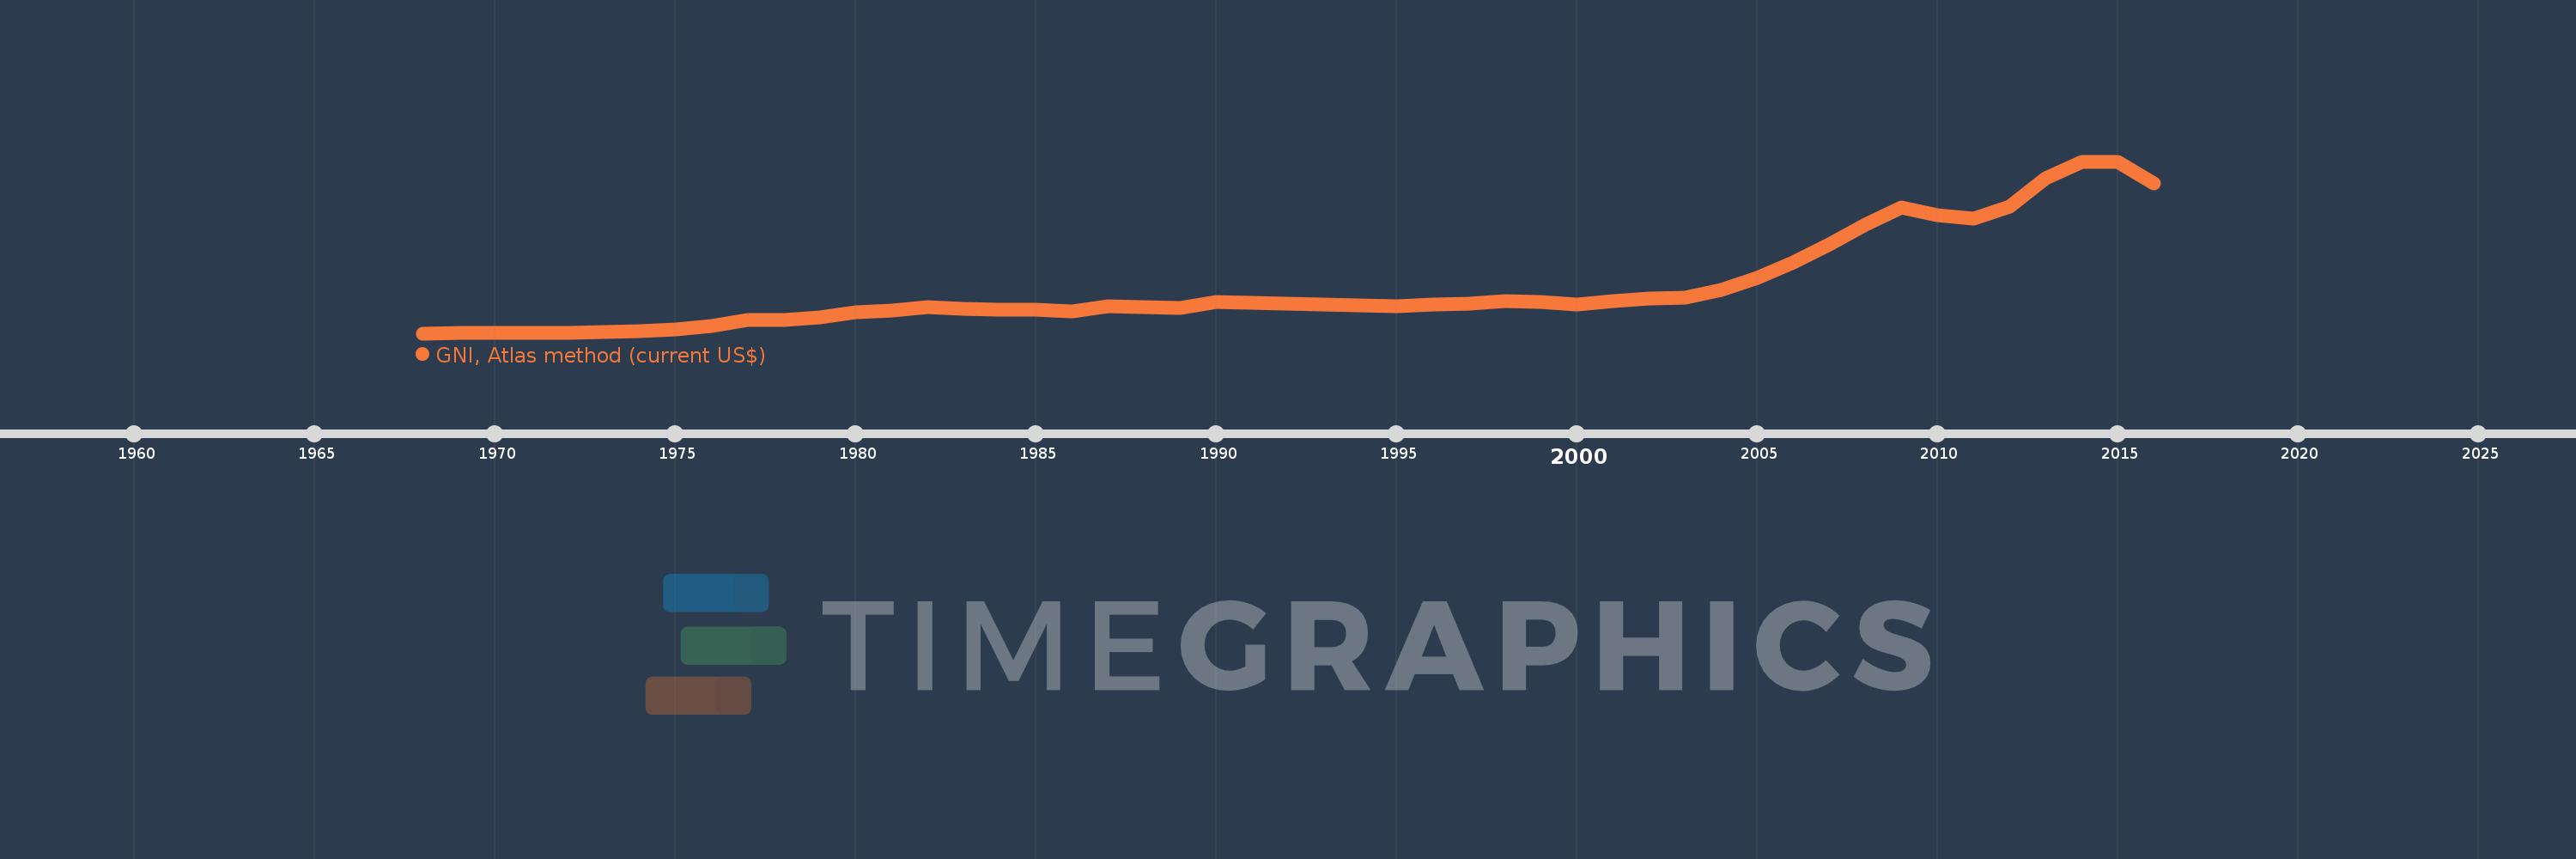
GNI, Atlas method (current US$)
2016,2015,2014,2013,2012,2011,2010,2009,2008,2007,2006,2005,2004,2003,2002,2001,2000,1999,1998,1997,1996,1995,1990,1989,1988,1987,1986,1985,1984,1983,1982,1981,1980,1979,1978,1977,1976,1975,1974,1973,1972,1971,1970,1969,1968
Estas estadísticas en otros países:
AfghanistanAlbaniaAlgeriaAndorraAngolaAntigua and BarbudaArab WorldArgentinaArmeniaAustraliaAustriaAzerbaijanBahamas, TheBahrainBangladeshBarbadosBelarusBelgiumBelizeBeninBermudaBhutanBoliviaBosnia and HerzegovinaBotswanaBrazilBrunei DarussalamBulgariaBurkina FasoBurundiCabo VerdeCambodiaCameroonCanadaCaribbean small statesCentral African RepublicCentral Europe and the BalticsChadChannel IslandsChileChinaColombiaComorosCongo, Dem. Rep.Congo, Rep.Costa RicaCote d'IvoireCroatiaCubaCyprusCzech RepublicDenmarkDjiboutiDominicaDominican RepublicEarly-demographic dividendEast Asia & PacificEast Asia & Pacific (excluding high income)East Asia & Pacific (IDA & IBRD countries)EcuadorEgypt, Arab Rep.El SalvadorEquatorial GuineaEritreaEstoniaEthiopiaEuro areaEurope & Central AsiaEurope & Central Asia (excluding high income)Europe & Central Asia (IDA & IBRD countries)European UnionFijiFinlandFragile and conflict affected situationsFranceFrench PolynesiaGabonGambia, TheGeorgiaGermanyGhanaGreeceGreenlandGrenadaGuatemalaGuineaGuinea-BissauGuyanaHaitiHeavily indebted poor countries (HIPC)High incomeHondurasHong Kong SAR, ChinaHungaryIBRD onlyIcelandIDA & IBRD totalIDA blendIDA onlyIDA totalIndiaIndonesiaIran, Islamic Rep.IraqIrelandIsle of ManIsraelItalyJamaicaJapanJordanKazakhstanKenyaKiribatiKorea, Rep.KosovoKuwaitKyrgyz RepublicLao PDRLate-demographic dividendLatin America & Caribbean Latin America & Caribbean (excluding high income)Latin America & the Caribbean (IDA & IBRD countries)LatviaLeast developed countries: UN classificationLebanonLesothoLiberiaLibyaLiechtensteinLithuaniaLow & middle incomeLow incomeLower middle incomeLuxembourgMacao SAR, ChinaMacedonia, FYRMadagascarMalawiMalaysiaMaldivesMaliMaltaMarshall IslandsMauritaniaMauritiusMexicoMicronesia, Fed. Sts.Middle East & North AfricaMiddle East & North Africa (excluding high income)Middle East & North Africa (IDA & IBRD countries)Middle incomeMoldovaMonacoMongoliaMontenegroMoroccoMozambiqueMyanmarNamibiaNauruNepalNetherlandsNew CaledoniaNew ZealandNicaraguaNigerNigeriaNorth AmericaNorwayOECD membersOmanOther small statesPacific island small statesPakistanPalauPanamaPapua New GuineaParaguayPeruPhilippinesPolandPortugalPost-demographic dividendPre-demographic dividendPuerto RicoQatarRomaniaRussian FederationRwandaSamoaSan MarinoSao Tome and PrincipeSaudi ArabiaSenegalSerbiaSeychellesSierra LeoneSingaporeSlovak RepublicSloveniaSmall statesSolomon IslandsSouth AfricaSouth AsiaSouth Asia (IDA & IBRD)South SudanSpainSri LankaSt. Kitts and NevisSt. LuciaSt. Vincent and the GrenadinesSub-Saharan Africa Sub-Saharan Africa (excluding high income)Sub-Saharan Africa (IDA & IBRD countries)SudanSurinameSwazilandSwedenSwitzerlandSyrian Arab RepublicTajikistanTanzaniaThailandTimor-LesteTogoTongaTrinidad and TobagoTunisiaTurkeyTurkmenistanTuvaluUgandaUkraineUnited Arab EmiratesUnited KingdomUnited StatesUpper middle incomeUruguayUzbekistanVanuatuVenezuela, RBVietnamVirgin Islands (U.S.)West Bank and GazaWorldYemen, Rep.ZambiaZimbabwe línea de tiempo (timeline):
En esta escala de tiempo se presenta un gráfico de 1968 y 2016 de Kuwait. Los datos de 1967 están ausentes. El número de observaciones reales por fecha: 45.
Fuente (nombre):
Indicadores del desarrollo mundial
Fuente (organización):
World Bank national accounts data, and OECD National Accounts data files.
Categorías:
Economy & Growth
Se ha actualizado:
23 abr 2017 año
Los indicadores de los cambios de valor en los últimos años
Mínimo:
2.114 bn
1 ene 1968 año
Máximo:
187.315 bn
1 ene 2015 año
A la fecha de observación
Valor
Cambio absoluto
El cambio con respecto al valor anterior
1 ene 1968 año
2.114 bn
+2.114 bn
0.0%
1 ene 1969 año
2.322 bn
+207.744 millones
9.83%
1 ene 1970 año
2.45 bn
+127.903 millones
5.51%
1 ene 1971 año
2.487 bn
+37.101 millones
1.51%
1 ene 1972 año
2.834 bn
+347.642 millones
13.98%
1 ene 1973 año
3.13 bn
+296.004 millones
10.44%
1 ene 1974 año
3.975 bn
+844.782 millones
26.99%
1 ene 1975 año
6.409 bn
+2.433 bn
61.22%
1 ene 1976 año
10.345 bn
+3.936 bn
61.42%
1 ene 1977 año
16.227 bn
+5.883 bn
56.87%
1 ene 1978 año
16.252 bn
+24.86 millones
0.15%
1 ene 1979 año
18.945 bn
+2.693 bn
16.57%
1 ene 1980 año
25.004 bn
+6.059 bn
31.98%
1 ene 1981 año
26.701 bn
+1.697 bn
6.79%
1 ene 1982 año
30.703 bn
+4.001 bn
14.99%
1 ene 1983 año
28.432 bn
-2.271 bn
-7.4%
1 ene 1984 año
28.021 bn
-411.077 millones
-1.45%
1 ene 1985 año
27.61 bn
-410.714 millones
-1.47%
1 ene 1986 año
25.52 bn
-2.09 bn
-7.57%
1 ene 1987 año
30.828 bn
+5.309 bn
20.8%
1 ene 1988 año
29.967 bn
-861.52 millones
-2.79%
1 ene 1989 año
29.146 bn
-820.961 millones
-2.74%
1 ene 1990 año
36.372 bn
+7.226 bn
24.79%
1 ene 1995 año
30.869 bn
-5.502 bn
-15.13%
1 ene 1996 año
32.951 bn
+2.082 bn
6.74%
1 ene 1997 año
33.954 bn
+1.002 bn
3.04%
1 ene 1998 año
36.744 bn
+2.791 bn
8.22%
1 ene 1999 año
36.03 bn
-713.851 millones
-1.94%
1 ene 2000 año
32.924 bn
-3.107 bn
-8.62%
1 ene 2001 año
36.765 bn
+3.841 bn
11.67%
1 ene 2002 año
39.391 bn
+2.626 bn
7.14%
1 ene 2003 año
40.499 bn
+1.109 bn
2.81%
1 ene 2004 año
48.846 bn
+8.347 bn
20.61%
1 ene 2005 año
62.036 bn
+13.19 bn
27.0%
1 ene 2006 año
78.321 bn
+16.285 bn
26.25%
1 ene 2007 año
98.292 bn
+19.971 bn
25.5%
1 ene 2008 año
119.141 bn
+20.849 bn
21.21%
1 ene 2009 año
137.352 bn
+18.211 bn
15.28%
1 ene 2010 año
129.674 bn
-7.677 bn
-5.59%
1 ene 2011 año
126.114 bn
-3.56 bn
-2.75%
1 ene 2012 año
138.844 bn
+12.729 bn
10.09%
1 ene 2013 año
169.625 bn
+30.781 bn
22.17%
1 ene 2014 año
187.083 bn
+17.459 bn
10.29%
1 ene 2015 año
187.315 bn
+232.057 millones
0.12%
1 ene 2016 año
164.041 bn
-23.275 bn
-12.43%
Ranking de los países por los datos estadísticos actuales


Comentarios: