29
/es/
es
AIzaSyAYiBZKx7MnpbEhh9jyipgxe19OcubqV5w
April 1, 2024
156017
Indonesia
IDN
true
2
1
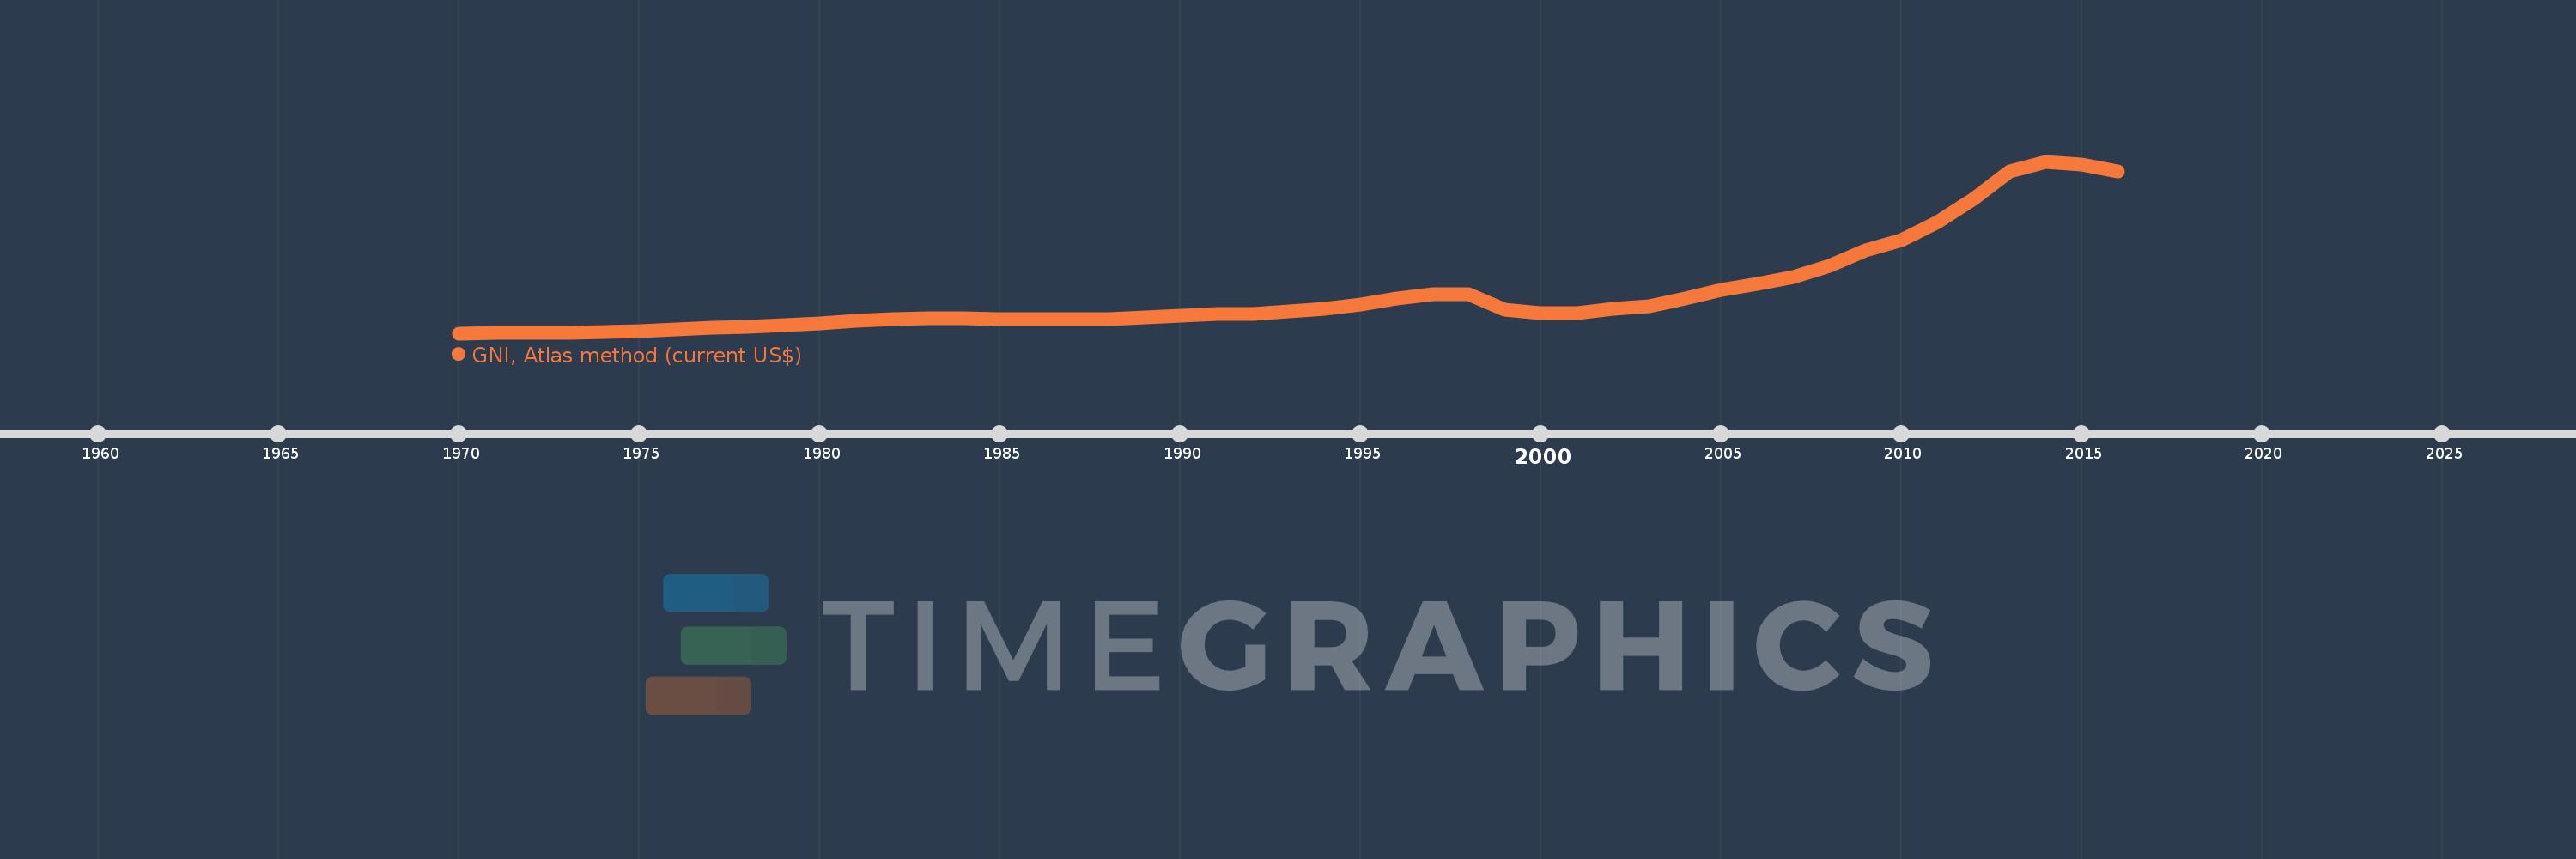
GNI, Atlas method (current US$)
2016,2015,2014,2013,2012,2011,2010,2009,2008,2007,2006,2005,2004,2003,2002,2001,2000,1999,1998,1997,1996,1995,1994,1993,1992,1991,1990,1989,1988,1987,1986,1985,1984,1983,1982,1981,1980,1979,1978,1977,1976,1975,1974,1973,1972,1971,1970
Estas estadísticas en otros países:
AfghanistanAlbaniaAlgeriaAndorraAngolaAntigua and BarbudaArab WorldArgentinaArmeniaAustraliaAustriaAzerbaijanBahamas, TheBahrainBangladeshBarbadosBelarusBelgiumBelizeBeninBermudaBhutanBoliviaBosnia and HerzegovinaBotswanaBrazilBrunei DarussalamBulgariaBurkina FasoBurundiCabo VerdeCambodiaCameroonCanadaCaribbean small statesCentral African RepublicCentral Europe and the BalticsChadChannel IslandsChileChinaColombiaComorosCongo, Dem. Rep.Congo, Rep.Costa RicaCote d'IvoireCroatiaCubaCyprusCzech RepublicDenmarkDjiboutiDominicaDominican RepublicEarly-demographic dividendEast Asia & PacificEast Asia & Pacific (excluding high income)East Asia & Pacific (IDA & IBRD countries)EcuadorEgypt, Arab Rep.El SalvadorEquatorial GuineaEritreaEstoniaEthiopiaEuro areaEurope & Central AsiaEurope & Central Asia (excluding high income)Europe & Central Asia (IDA & IBRD countries)European UnionFijiFinlandFragile and conflict affected situationsFranceFrench PolynesiaGabonGambia, TheGeorgiaGermanyGhanaGreeceGreenlandGrenadaGuatemalaGuineaGuinea-BissauGuyanaHaitiHeavily indebted poor countries (HIPC)High incomeHondurasHong Kong SAR, ChinaHungaryIBRD onlyIcelandIDA & IBRD totalIDA blendIDA onlyIDA totalIndiaIndonesiaIran, Islamic Rep.IraqIrelandIsle of ManIsraelItalyJamaicaJapanJordanKazakhstanKenyaKiribatiKorea, Rep.KosovoKuwaitKyrgyz RepublicLao PDRLate-demographic dividendLatin America & Caribbean Latin America & Caribbean (excluding high income)Latin America & the Caribbean (IDA & IBRD countries)LatviaLeast developed countries: UN classificationLebanonLesothoLiberiaLibyaLiechtensteinLithuaniaLow & middle incomeLow incomeLower middle incomeLuxembourgMacao SAR, ChinaMacedonia, FYRMadagascarMalawiMalaysiaMaldivesMaliMaltaMarshall IslandsMauritaniaMauritiusMexicoMicronesia, Fed. Sts.Middle East & North AfricaMiddle East & North Africa (excluding high income)Middle East & North Africa (IDA & IBRD countries)Middle incomeMoldovaMonacoMongoliaMontenegroMoroccoMozambiqueMyanmarNamibiaNauruNepalNetherlandsNew CaledoniaNew ZealandNicaraguaNigerNigeriaNorth AmericaNorwayOECD membersOmanOther small statesPacific island small statesPakistanPalauPanamaPapua New GuineaParaguayPeruPhilippinesPolandPortugalPost-demographic dividendPre-demographic dividendPuerto RicoQatarRomaniaRussian FederationRwandaSamoaSan MarinoSao Tome and PrincipeSaudi ArabiaSenegalSerbiaSeychellesSierra LeoneSingaporeSlovak RepublicSloveniaSmall statesSolomon IslandsSouth AfricaSouth AsiaSouth Asia (IDA & IBRD)South SudanSpainSri LankaSt. Kitts and NevisSt. LuciaSt. Vincent and the GrenadinesSub-Saharan Africa Sub-Saharan Africa (excluding high income)Sub-Saharan Africa (IDA & IBRD countries)SudanSurinameSwazilandSwedenSwitzerlandSyrian Arab RepublicTajikistanTanzaniaThailandTimor-LesteTogoTongaTrinidad and TobagoTunisiaTurkeyTurkmenistanTuvaluUgandaUkraineUnited Arab EmiratesUnited KingdomUnited StatesUpper middle incomeUruguayUzbekistanVanuatuVenezuela, RBVietnamVirgin Islands (U.S.)West Bank and GazaWorldYemen, Rep.ZambiaZimbabwe línea de tiempo (timeline):
En esta escala de tiempo se presenta un gráfico de 1970 y 2016 de Indonesia. Los datos de 1969 están ausentes. El número de observaciones reales por fecha: 47.
Fuente (nombre):
Indicadores del desarrollo mundial
Fuente (organización):
World Bank national accounts data, and OECD National Accounts data files.
Categorías:
Economy & Growth
Se ha actualizado:
23 abr 2017 año
Los indicadores de los cambios de valor en los últimos años
Mínimo:
8.426 bn
1 ene 1970 año
Máximo:
939.988 bn
1 ene 2014 año
A la fecha de observación
Valor
Cambio absoluto
El cambio con respecto al valor anterior
1 ene 1970 año
8.426 bn
+8.426 bn
0.0%
1 ene 1971 año
9.796 bn
+1.37 bn
16.26%
1 ene 1972 año
10.68 bn
+883.564 millones
9.02%
1 ene 1973 año
11.802 bn
+1.122 bn
10.51%
1 ene 1974 año
15.209 bn
+3.407 bn
28.87%
1 ene 1975 año
21.87 bn
+6.661 bn
43.8%
1 ene 1976 año
30.6 bn
+8.73 bn
39.92%
1 ene 1977 año
38.041 bn
+7.441 bn
24.32%
1 ene 1978 año
44.871 bn
+6.83 bn
17.95%
1 ene 1979 año
54.571 bn
+9.7 bn
21.62%
1 ene 1980 año
61.61 bn
+7.039 bn
12.9%
1 ene 1981 año
74.643 bn
+13.033 bn
21.15%
1 ene 1982 año
87.031 bn
+12.387 bn
16.6%
1 ene 1983 año
89.224 bn
+2.194 bn
2.52%
1 ene 1984 año
90.107 bn
+882.711 millones
0.99%
1 ene 1985 año
87.517 bn
-2.59 bn
-2.87%
1 ene 1986 año
84.735 bn
-2.782 bn
-3.18%
1 ene 1987 año
86.252 bn
+1.517 bn
1.79%
1 ene 1988 año
87.092 bn
+839.962 millones
0.97%
1 ene 1989 año
95.548 bn
+8.456 bn
9.71%
1 ene 1990 año
102.043 bn
+6.495 bn
6.8%
1 ene 1991 año
112.016 bn
+9.973 bn
9.77%
1 ene 1992 año
113.901 bn
+1.884 bn
1.68%
1 ene 1993 año
125.684 bn
+11.784 bn
10.35%
1 ene 1994 año
143.032 bn
+17.348 bn
13.8%
1 ene 1995 año
165.7 bn
+22.668 bn
15.85%
1 ene 1996 año
194.814 bn
+29.114 bn
17.57%
1 ene 1997 año
218.092 bn
+23.278 bn
11.95%
1 ene 1998 año
222.424 bn
+4.332 bn
1.99%
1 ene 1999 año
135.08 bn
-87.344 bn
-39.27%
1 ene 2000 año
119.651 bn
-15.43 bn
-11.42%
1 ene 2001 año
119.462 bn
-188.747 millones
-0.16%
1 ene 2002 año
143.15 bn
+23.688 bn
19.83%
1 ene 2003 año
156.66 bn
+13.51 bn
9.44%
1 ene 2004 año
198.234 bn
+41.574 bn
26.54%
1 ene 2005 año
241.393 bn
+43.159 bn
21.77%
1 ene 2006 año
276.759 bn
+35.366 bn
14.65%
1 ene 2007 año
315.565 bn
+38.806 bn
14.02%
1 ene 2008 año
371.909 bn
+56.344 bn
17.85%
1 ene 2009 año
457.09 bn
+85.181 bn
22.9%
1 ene 2010 año
512.966 bn
+55.876 bn
12.22%
1 ene 2011 año
611.76 bn
+98.795 bn
19.26%
1 ene 2012 año
736.173 bn
+124.413 bn
20.34%
1 ene 2013 año
888.561 bn
+152.388 bn
20.7%
1 ene 2014 año
939.988 bn
+51.427 bn
5.79%
1 ene 2015 año
923.149 bn
-16.839 bn
-1.79%
1 ene 2016 año
887.028 bn
-36.121 bn
-3.91%
Ranking de los países por los datos estadísticos actuales


Comentarios: