29
/es/
es
AIzaSyAYiBZKx7MnpbEhh9jyipgxe19OcubqV5w
April 1, 2024
167510
Kenya
KEN
true
2
1
GNI (constant 2010 US$)
2016,2015,2014,2013,2012,2011,2010,2009,2008,2007,2006,2005,2004,2003,2002,2001,2000,1999,1998,1997,1996,1995,1994,1993,1992,1991,1990,1989,1988,1987,1986,1985,1984,1983,1982,1981,1980,1979,1978,1977,1976,1975,1974,1973,1972,1971,1970,1969,1968,1967,1966,1965,1964,1963,1962,1961
Estas estadísticas en otros países:
AfghanistanAlbaniaAlgeriaAndorraAngolaAntigua and BarbudaArab WorldArgentinaArmeniaAustraliaAustriaAzerbaijanBahamas, TheBahrainBangladeshBarbadosBelarusBelgiumBelizeBeninBermudaBhutanBoliviaBosnia and HerzegovinaBotswanaBrazilBrunei DarussalamBulgariaBurkina FasoBurundiCabo VerdeCambodiaCameroonCanadaCaribbean small statesCentral African RepublicCentral Europe and the BalticsChadChileChinaColombiaComorosCongo, Dem. Rep.Congo, Rep.Costa RicaCote d'IvoireCroatiaCubaCyprusCzech RepublicDenmarkDominicaDominican RepublicEarly-demographic dividendEast Asia & PacificEast Asia & Pacific (excluding high income)East Asia & Pacific (IDA & IBRD countries)EcuadorEgypt, Arab Rep.El SalvadorEquatorial GuineaEritreaEstoniaEthiopiaEuro areaEurope & Central AsiaEurope & Central Asia (excluding high income)Europe & Central Asia (IDA & IBRD countries)European UnionFaroe IslandsFijiFinlandFragile and conflict affected situationsFranceGabonGambia, TheGeorgiaGermanyGhanaGreeceGrenadaGuatemalaGuineaGuinea-BissauGuyanaHaitiHeavily indebted poor countries (HIPC)High incomeHondurasHong Kong SAR, ChinaHungaryIBRD onlyIcelandIDA & IBRD totalIDA blendIDA onlyIDA totalIndiaIndonesiaIran, Islamic Rep.IraqIrelandIsle of ManIsraelItalyJamaicaJapanJordanKazakhstanKenyaKiribatiKorea, Rep.KosovoKuwaitKyrgyz RepublicLao PDRLate-demographic dividendLatin America & Caribbean Latin America & Caribbean (excluding high income)Latin America & the Caribbean (IDA & IBRD countries)LatviaLeast developed countries: UN classificationLebanonLesothoLiberiaLibyaLiechtensteinLithuaniaLow & middle incomeLow incomeLower middle incomeLuxembourgMacao SAR, ChinaMacedonia, FYRMadagascarMalawiMalaysiaMaldivesMaliMaltaMarshall IslandsMauritaniaMauritiusMexicoMicronesia, Fed. Sts.Middle East & North AfricaMiddle East & North Africa (excluding high income)Middle East & North Africa (IDA & IBRD countries)Middle incomeMoldovaMongoliaMontenegroMoroccoMozambiqueMyanmarNamibiaNauruNepalNetherlandsNew ZealandNicaraguaNigerNigeriaNorth AmericaNorwayOECD membersOmanOther small statesPacific island small statesPakistanPalauPanamaPapua New GuineaParaguayPeruPhilippinesPolandPortugalPost-demographic dividendPre-demographic dividendPuerto RicoQatarRomaniaRussian FederationRwandaSamoaSao Tome and PrincipeSaudi ArabiaSenegalSerbiaSeychellesSierra LeoneSingaporeSlovak RepublicSloveniaSmall statesSolomon IslandsSouth AfricaSouth AsiaSouth Asia (IDA & IBRD)South SudanSpainSri LankaSt. Kitts and NevisSt. LuciaSt. Vincent and the GrenadinesSub-Saharan Africa Sub-Saharan Africa (excluding high income)Sub-Saharan Africa (IDA & IBRD countries)SudanSurinameSwazilandSwedenSwitzerlandTajikistanTanzaniaThailandTimor-LesteTogoTongaTrinidad and TobagoTunisiaTurkeyTurkmenistanTuvaluUgandaUkraineUnited Arab EmiratesUnited KingdomUnited StatesUpper middle incomeUruguayUzbekistanVanuatuVenezuela, RBVietnamWest Bank and GazaWorldYemen, Rep.ZambiaZimbabwe línea de tiempo (timeline):
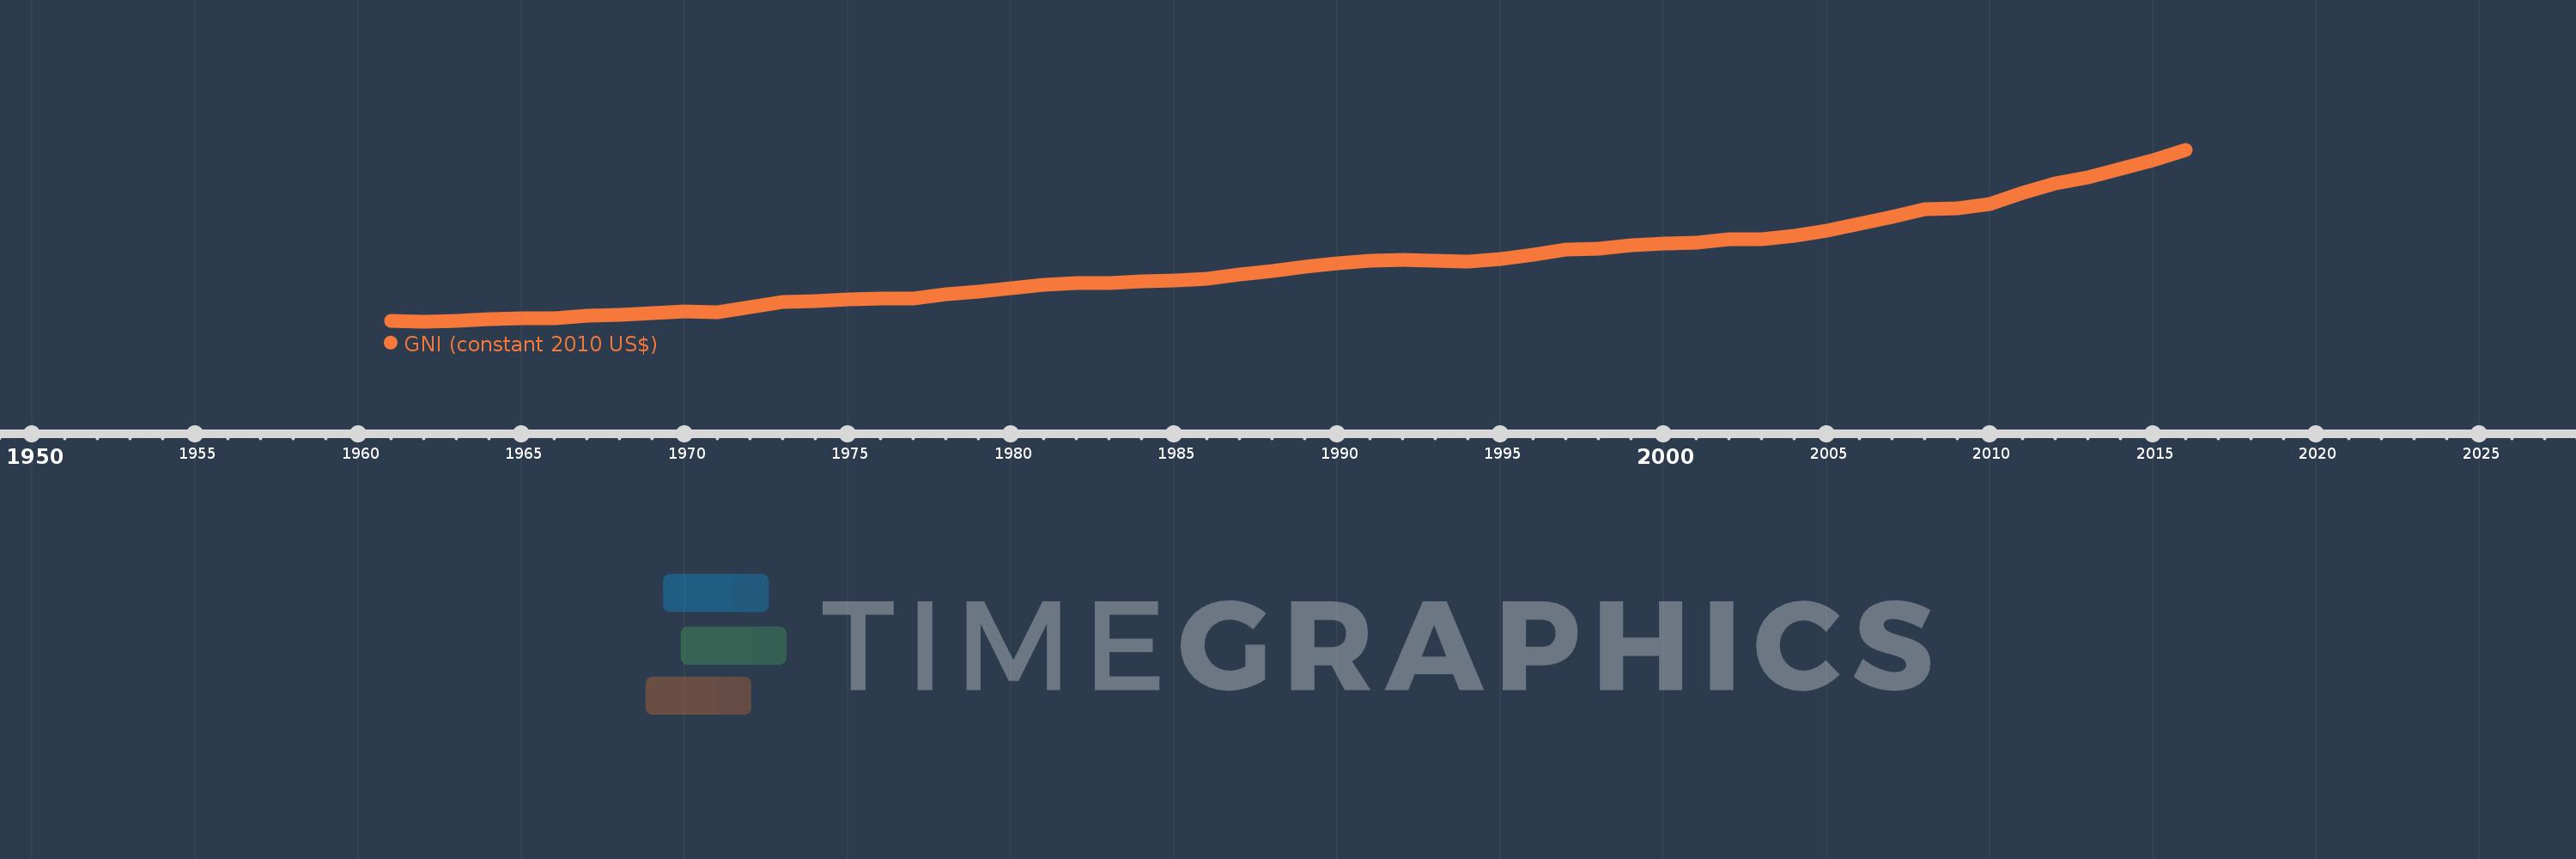
En esta escala de tiempo se presenta un gráfico de 1961 y 2016 de Kenya. Los datos de 1960 están ausentes. El número de observaciones reales por fecha: 56.
Fuente (nombre):
Indicadores del desarrollo mundial
Fuente (organización):
World Bank national accounts data, and OECD National Accounts data files.
Categorías:
Economy & Growth
Se ha actualizado:
23 abr 2017 año
Los indicadores de los cambios de valor en los últimos años
Mínimo:
3.908 bn
1 ene 1962 año
Máximo:
51.827 bn
1 ene 2016 año
A la fecha de observación
Valor
Cambio absoluto
El cambio con respecto al valor anterior
1 ene 1961 año
4.219 bn
+4.219 bn
0.0%
1 ene 1962 año
3.908 bn
-311.298 millones
-7.38%
1 ene 1963 año
4.289 bn
+380.928 millones
9.75%
1 ene 1964 año
4.651 bn
+361.547 millones
8.43%
1 ene 1965 año
4.882 bn
+231.019 millones
4.97%
1 ene 1966 año
4.999 bn
+117.32 millones
2.4%
1 ene 1967 año
5.715 bn
+716.161 millones
14.33%
1 ene 1968 año
5.898 bn
+182.485 millones
3.19%
1 ene 1969 año
6.382 bn
+484.306 millones
8.21%
1 ene 1970 año
6.968 bn
+585.785 millones
9.18%
1 ene 1971 año
6.667 bn
-300.458 millones
-4.31%
1 ene 1972 año
8.152 bn
+1.485 bn
22.27%
1 ene 1973 año
9.519 bn
+1.368 bn
16.78%
1 ene 1974 año
9.837 bn
+317.195 millones
3.33%
1 ene 1975 año
10.324 bn
+487.154 millones
4.95%
1 ene 1976 año
10.472 bn
+148.012 millones
1.43%
1 ene 1977 año
10.553 bn
+81.308 millones
0.78%
1 ene 1978 año
11.593 bn
+1.04 bn
9.85%
1 ene 1979 año
12.428 bn
+835.258 millones
7.2%
1 ene 1980 año
13.365 bn
+937.115 millones
7.54%
1 ene 1981 año
14.187 bn
+821.789 millones
6.15%
1 ene 1982 año
14.712 bn
+525.007 millones
3.7%
1 ene 1983 año
14.838 bn
+125.598 millones
0.85%
1 ene 1984 año
15.137 bn
+299.481 millones
2.02%
1 ene 1985 año
15.393 bn
+256.03 millones
1.69%
1 ene 1986 año
16.043 bn
+650.118 millones
4.22%
1 ene 1987 año
17.204 bn
+1.161 bn
7.24%
1 ene 1988 año
18.188 bn
+983.138 millones
5.71%
1 ene 1989 año
19.247 bn
+1.06 bn
5.83%
1 ene 1990 año
20.337 bn
+1.09 bn
5.66%
1 ene 1991 año
20.947 bn
+609.541 millones
3.0%
1 ene 1992 año
21.152 bn
+205.632 millones
0.98%
1 ene 1993 año
21.028 bn
-124.027 millones
-0.59%
1 ene 1994 año
20.666 bn
-361.784 millones
-1.72%
1 ene 1995 año
21.457 bn
+790.358 millones
3.82%
1 ene 1996 año
22.782 bn
+1.325 bn
6.18%
1 ene 1997 año
24.106 bn
+1.324 bn
5.81%
1 ene 1998 año
24.34 bn
+233.804 millones
0.97%
1 ene 1999 año
25.23 bn
+890.184 millones
3.66%
1 ene 2000 año
25.708 bn
+477.52 millones
1.89%
1 ene 2001 año
25.95 bn
+241.883 millones
0.94%
1 ene 2002 año
26.893 bn
+943.49 millones
3.64%
1 ene 2003 año
27.094 bn
+200.553 millones
0.75%
1 ene 2004 año
27.843 bn
+749.175 millones
2.77%
1 ene 2005 año
29.33 bn
+1.487 bn
5.34%
1 ene 2006 año
31.311 bn
+1.981 bn
6.75%
1 ene 2007 año
33.261 bn
+1.95 bn
6.23%
1 ene 2008 año
35.48 bn
+2.219 bn
6.67%
1 ene 2009 año
35.685 bn
+205.596 millones
0.58%
1 ene 2010 año
36.852 bn
+1.167 bn
3.27%
1 ene 2011 año
39.852 bn
+3.0 bn
8.14%
1 ene 2012 año
42.448 bn
+2.596 bn
6.51%
1 ene 2013 año
44.247 bn
+1.799 bn
4.24%
1 ene 2014 año
46.644 bn
+2.397 bn
5.42%
1 ene 2015 año
49.084 bn
+2.44 bn
5.23%
1 ene 2016 año
51.827 bn
+2.743 bn
5.59%
Ranking de los países por los datos estadísticos actuales


Comentarios: