29
/es/
es
AIzaSyAYiBZKx7MnpbEhh9jyipgxe19OcubqV5w
April 1, 2024
101104
Canada
CAN
true
2
1
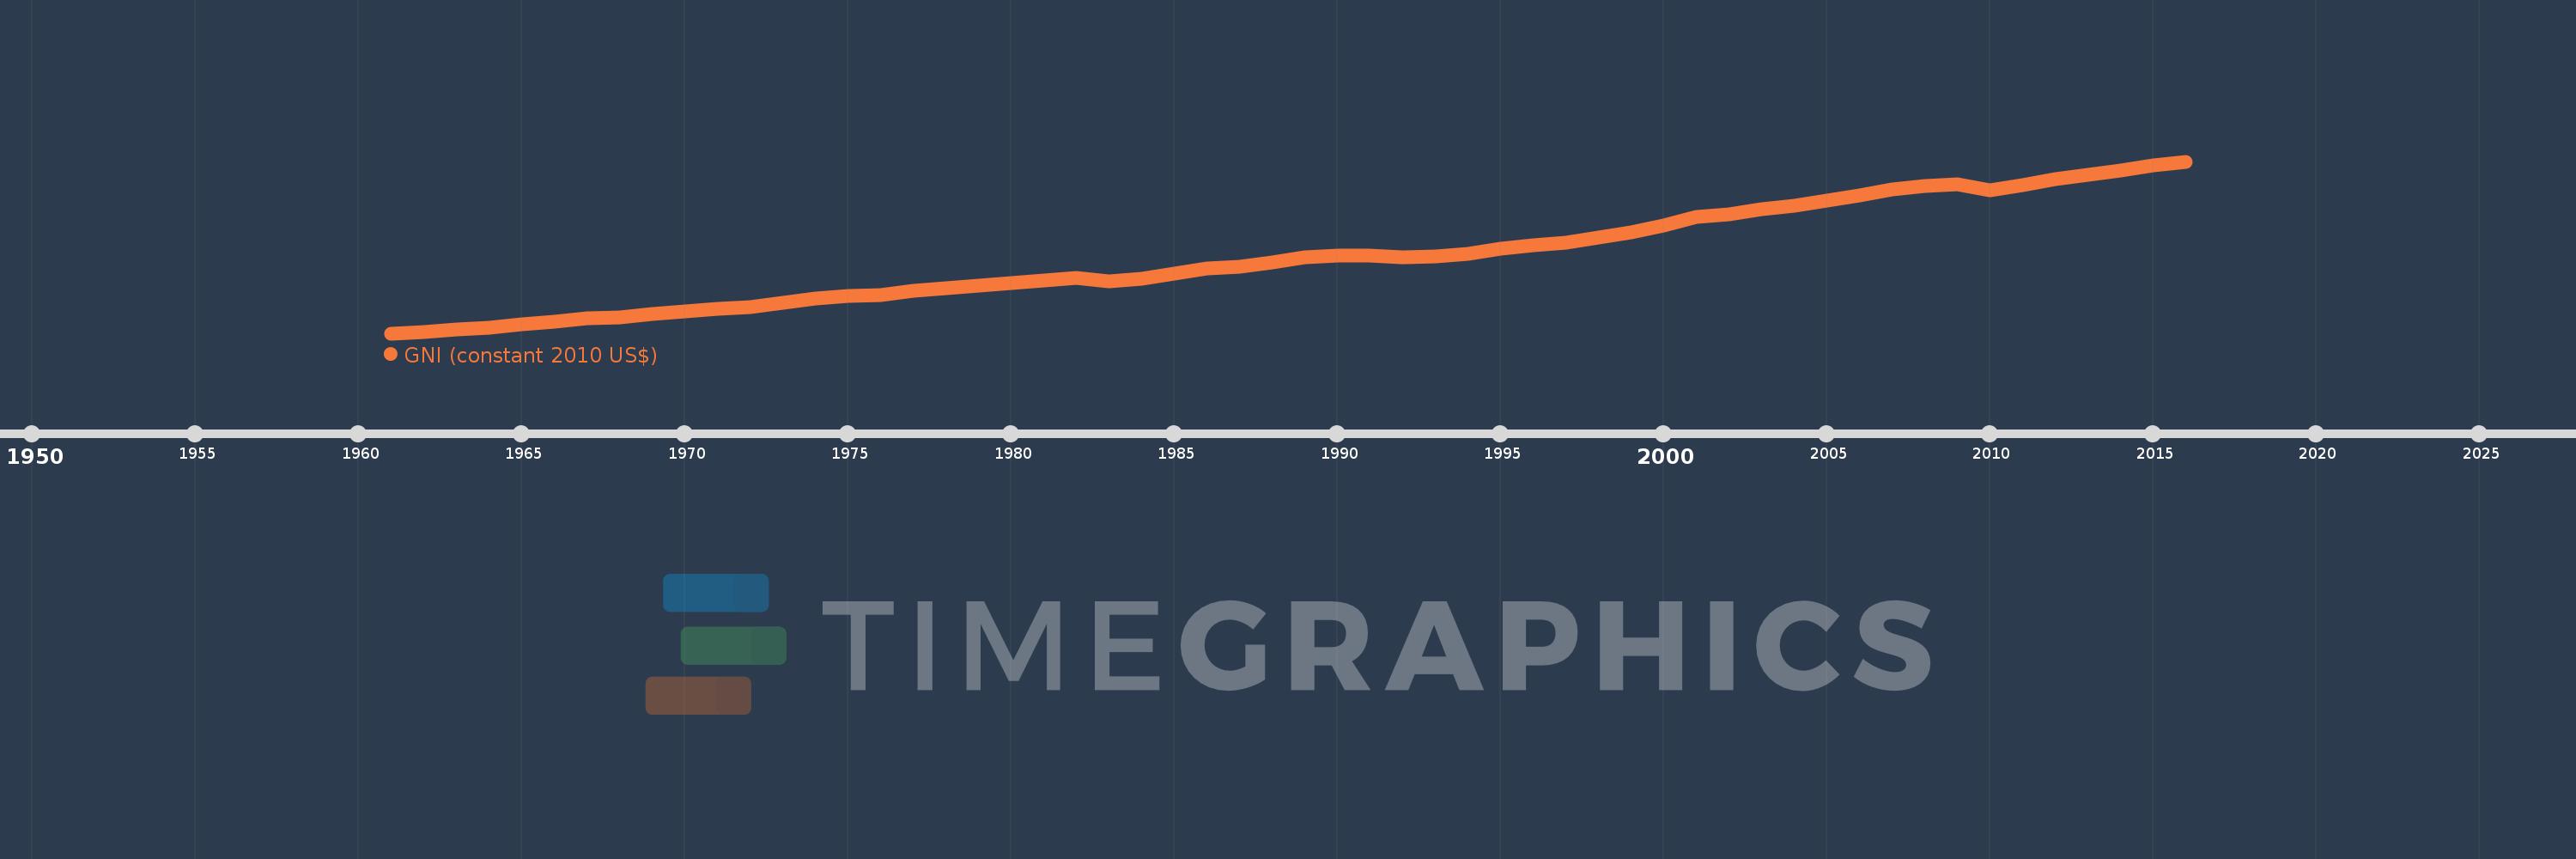
GNI (constant 2010 US$)
2016,2015,2014,2013,2012,2011,2010,2009,2008,2007,2006,2005,2004,2003,2002,2001,2000,1999,1998,1997,1996,1995,1994,1993,1992,1991,1990,1989,1988,1987,1986,1985,1984,1983,1982,1981,1980,1979,1978,1977,1976,1975,1974,1973,1972,1971,1970,1969,1968,1967,1966,1965,1964,1963,1962,1961
Estas estadísticas en otros países:
AfghanistanAlbaniaAlgeriaAndorraAngolaAntigua and BarbudaArab WorldArgentinaArmeniaAustraliaAustriaAzerbaijanBahamas, TheBahrainBangladeshBarbadosBelarusBelgiumBelizeBeninBermudaBhutanBoliviaBosnia and HerzegovinaBotswanaBrazilBrunei DarussalamBulgariaBurkina FasoBurundiCabo VerdeCambodiaCameroonCanadaCaribbean small statesCentral African RepublicCentral Europe and the BalticsChadChileChinaColombiaComorosCongo, Dem. Rep.Congo, Rep.Costa RicaCote d'IvoireCroatiaCubaCyprusCzech RepublicDenmarkDominicaDominican RepublicEarly-demographic dividendEast Asia & PacificEast Asia & Pacific (excluding high income)East Asia & Pacific (IDA & IBRD countries)EcuadorEgypt, Arab Rep.El SalvadorEquatorial GuineaEritreaEstoniaEthiopiaEuro areaEurope & Central AsiaEurope & Central Asia (excluding high income)Europe & Central Asia (IDA & IBRD countries)European UnionFaroe IslandsFijiFinlandFragile and conflict affected situationsFranceGabonGambia, TheGeorgiaGermanyGhanaGreeceGrenadaGuatemalaGuineaGuinea-BissauGuyanaHaitiHeavily indebted poor countries (HIPC)High incomeHondurasHong Kong SAR, ChinaHungaryIBRD onlyIcelandIDA & IBRD totalIDA blendIDA onlyIDA totalIndiaIndonesiaIran, Islamic Rep.IraqIrelandIsle of ManIsraelItalyJamaicaJapanJordanKazakhstanKenyaKiribatiKorea, Rep.KosovoKuwaitKyrgyz RepublicLao PDRLate-demographic dividendLatin America & Caribbean Latin America & Caribbean (excluding high income)Latin America & the Caribbean (IDA & IBRD countries)LatviaLeast developed countries: UN classificationLebanonLesothoLiberiaLibyaLiechtensteinLithuaniaLow & middle incomeLow incomeLower middle incomeLuxembourgMacao SAR, ChinaMacedonia, FYRMadagascarMalawiMalaysiaMaldivesMaliMaltaMarshall IslandsMauritaniaMauritiusMexicoMicronesia, Fed. Sts.Middle East & North AfricaMiddle East & North Africa (excluding high income)Middle East & North Africa (IDA & IBRD countries)Middle incomeMoldovaMongoliaMontenegroMoroccoMozambiqueMyanmarNamibiaNauruNepalNetherlandsNew ZealandNicaraguaNigerNigeriaNorth AmericaNorwayOECD membersOmanOther small statesPacific island small statesPakistanPalauPanamaPapua New GuineaParaguayPeruPhilippinesPolandPortugalPost-demographic dividendPre-demographic dividendPuerto RicoQatarRomaniaRussian FederationRwandaSamoaSao Tome and PrincipeSaudi ArabiaSenegalSerbiaSeychellesSierra LeoneSingaporeSlovak RepublicSloveniaSmall statesSolomon IslandsSouth AfricaSouth AsiaSouth Asia (IDA & IBRD)South SudanSpainSri LankaSt. Kitts and NevisSt. LuciaSt. Vincent and the GrenadinesSub-Saharan Africa Sub-Saharan Africa (excluding high income)Sub-Saharan Africa (IDA & IBRD countries)SudanSurinameSwazilandSwedenSwitzerlandTajikistanTanzaniaThailandTimor-LesteTogoTongaTrinidad and TobagoTunisiaTurkeyTurkmenistanTuvaluUgandaUkraineUnited Arab EmiratesUnited KingdomUnited StatesUpper middle incomeUruguayUzbekistanVanuatuVenezuela, RBVietnamWest Bank and GazaWorldYemen, Rep.ZambiaZimbabwe línea de tiempo (timeline):
En esta escala de tiempo se presenta un gráfico de 1961 y 2016 de Canada. Los datos de 1960 están ausentes. El número de observaciones reales por fecha: 56.
Fuente (nombre):
Indicadores del desarrollo mundial
Fuente (organización):
World Bank national accounts data, and OECD National Accounts data files.
Categorías:
Economy & Growth
Se ha actualizado:
23 abr 2017 año
Los indicadores de los cambios de valor en los últimos años
Mínimo:
311.712 bn
1 ene 1961 año
Máximo:
1.781 billones
1 ene 2016 año
A la fecha de observación
Valor
Cambio absoluto
El cambio con respecto al valor anterior
1 ene 1961 año
311.712 bn
+311.712 bn
0.0%
1 ene 1962 año
320.911 bn
+9.199 bn
2.95%
1 ene 1963 año
343.847 bn
+22.936 bn
7.15%
1 ene 1964 año
361.505 bn
+17.658 bn
5.14%
1 ene 1965 año
385.867 bn
+24.362 bn
6.74%
1 ene 1966 año
411.557 bn
+25.69 bn
6.66%
1 ene 1967 año
438.606 bn
+27.049 bn
6.57%
1 ene 1968 año
451.124 bn
+12.518 bn
2.85%
1 ene 1969 año
475.892 bn
+24.768 bn
5.49%
1 ene 1970 año
502.013 bn
+26.121 bn
5.49%
1 ene 1971 año
517.791 bn
+15.778 bn
3.14%
1 ene 1972 año
539.195 bn
+21.405 bn
4.13%
1 ene 1973 año
569.346 bn
+30.151 bn
5.59%
1 ene 1974 año
608.542 bn
+39.196 bn
6.88%
1 ene 1975 año
630.316 bn
+21.775 bn
3.58%
1 ene 1976 año
641.688 bn
+11.372 bn
1.8%
1 ene 1977 año
673.056 bn
+31.368 bn
4.89%
1 ene 1978 año
694.21 bn
+21.154 bn
3.14%
1 ene 1979 año
719.108 bn
+24.897 bn
3.59%
1 ene 1980 año
744.53 bn
+25.423 bn
3.54%
1 ene 1981 año
760.578 bn
+16.047 bn
2.16%
1 ene 1982 año
782.312 bn
+21.734 bn
2.86%
1 ene 1983 año
756.139 bn
-26.173 bn
-3.35%
1 ene 1984 año
780.023 bn
+23.885 bn
3.16%
1 ene 1985 año
824.968 bn
+44.945 bn
5.76%
1 ene 1986 año
864.52 bn
+39.552 bn
4.79%
1 ene 1987 año
880.775 bn
+16.255 bn
1.88%
1 ene 1988 año
919.279 bn
+38.504 bn
4.37%
1 ene 1989 año
958.459 bn
+39.18 bn
4.26%
1 ene 1990 año
978.669 bn
+20.21 bn
2.11%
1 ene 1991 año
978.764 bn
+94.407 millones
0.01%
1 ene 1992 año
960.912 bn
-17.852 bn
-1.82%
1 ene 1993 año
966.938 bn
+6.026 bn
0.63%
1 ene 1994 año
994.665 bn
+27.727 bn
2.87%
1 ene 1995 año
1.038 billones
+42.889 bn
4.31%
1 ene 1996 año
1.066 billones
+28.888 bn
2.78%
1 ene 1997 año
1.085 billones
+18.338 bn
1.72%
1 ene 1998 año
1.134 billones
+49.266 bn
4.54%
1 ene 1999 año
1.176 billones
+41.512 bn
3.66%
1 ene 2000 año
1.236 billones
+60.491 bn
5.15%
1 ene 2001 año
1.309 billones
+72.997 bn
5.91%
1 ene 2002 año
1.33 billones
+20.659 bn
1.58%
1 ene 2003 año
1.374 billones
+44.276 bn
3.33%
1 ene 2004 año
1.399 billones
+25.249 bn
1.84%
1 ene 2005 año
1.446 billones
+47.166 bn
3.37%
1 ene 2006 año
1.494 billones
+47.71 bn
3.3%
1 ene 2007 año
1.54 billones
+46.219 bn
3.09%
1 ene 2008 año
1.574 billones
+33.533 bn
2.18%
1 ene 2009 año
1.589 billones
+14.646 bn
0.93%
1 ene 2010 año
1.539 billones
-49.966 bn
-3.15%
1 ene 2011 año
1.583 billones
+44.168 bn
2.87%
1 ene 2012 año
1.634 billones
+51.29 bn
3.24%
1 ene 2013 año
1.664 billones
+30.014 bn
1.84%
1 ene 2014 año
1.706 billones
+42.101 bn
2.53%
1 ene 2015 año
1.746 billones
+39.973 bn
2.34%
1 ene 2016 año
1.781 billones
+35.241 bn
2.02%
Ranking de los países por los datos estadísticos actuales


Comentarios: