29
/es/
es
AIzaSyAYiBZKx7MnpbEhh9jyipgxe19OcubqV5w
April 1, 2024
157613
Iran, Islamic Rep.
IRN
true
2
1
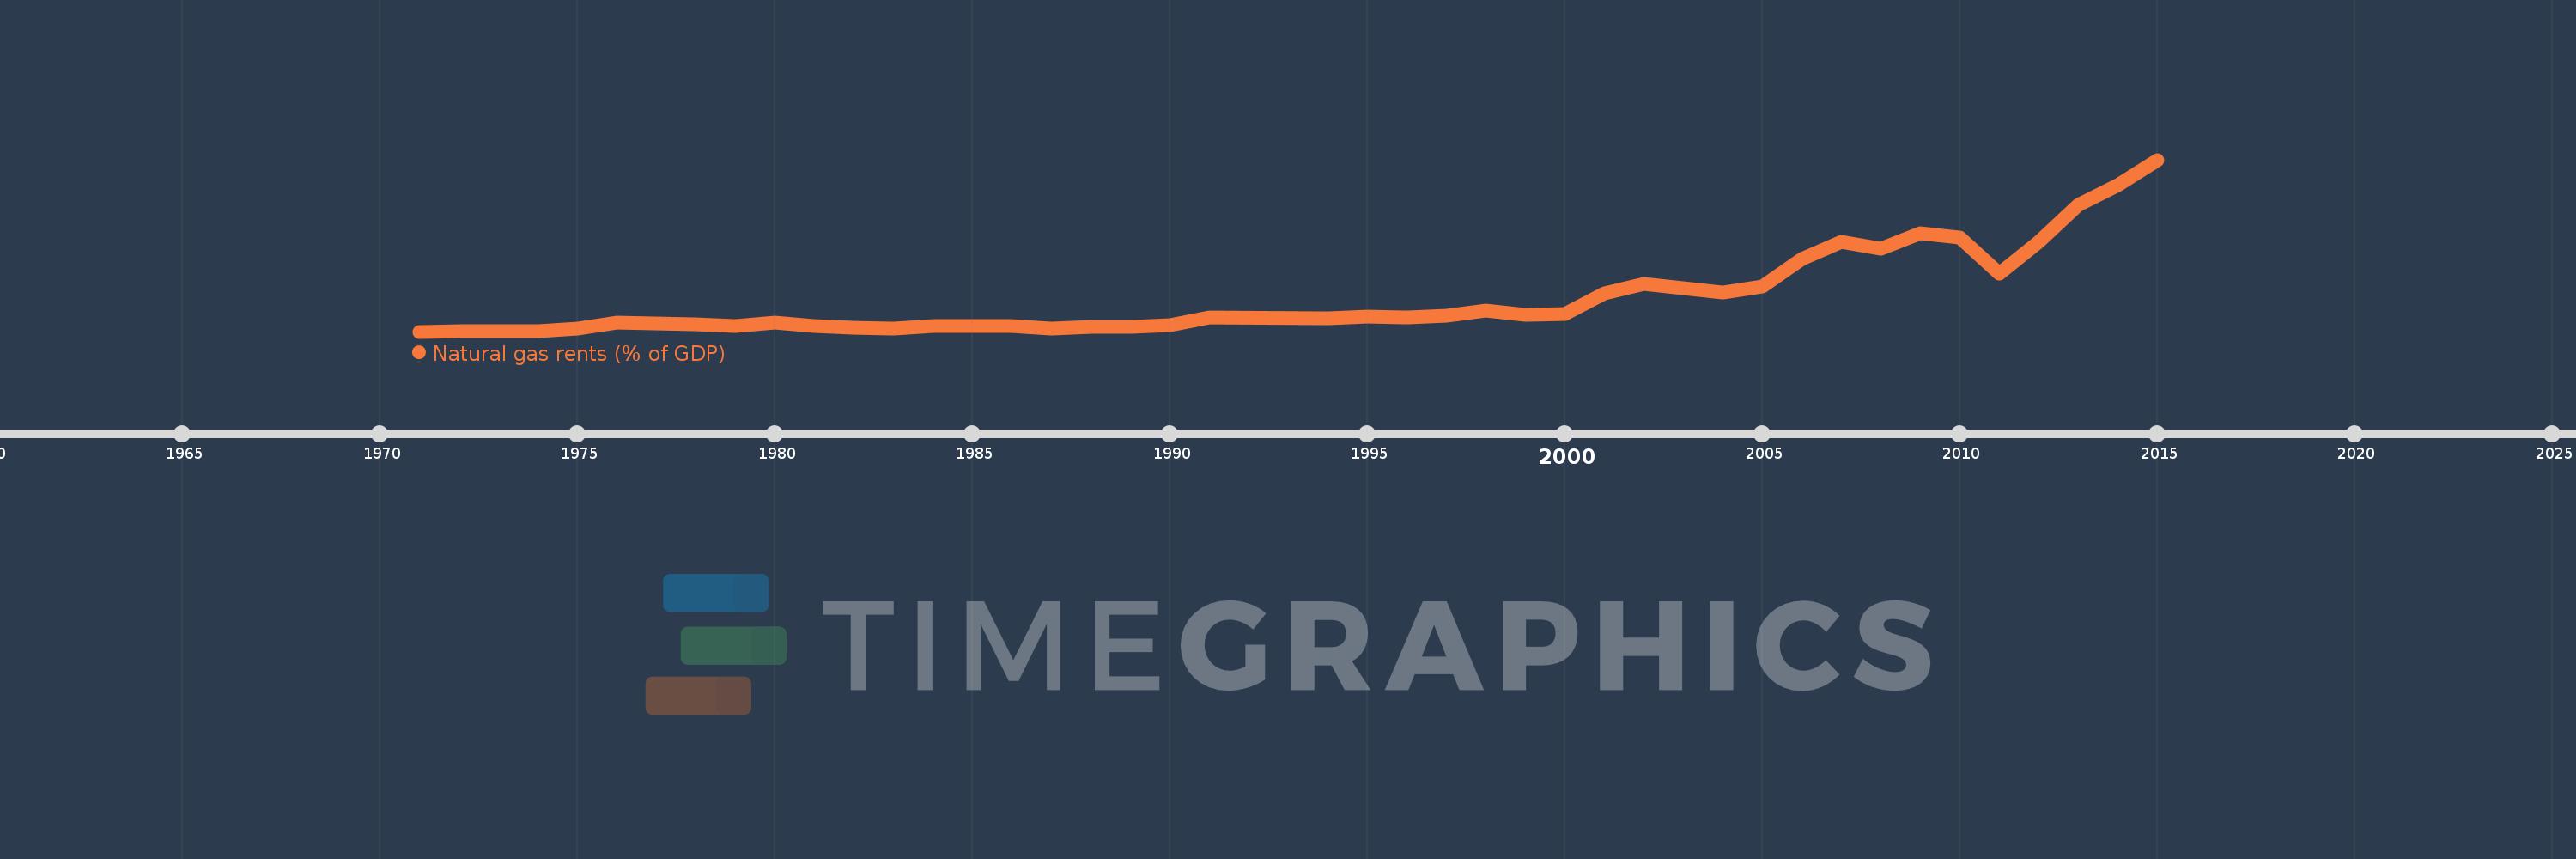
Natural gas rents (% of GDP)
2015,2014,2013,2012,2011,2010,2009,2008,2007,2006,2005,2004,2003,2002,2001,2000,1999,1998,1997,1996,1995,1994,1991,1990,1989,1988,1987,1986,1985,1984,1983,1982,1981,1980,1979,1978,1977,1976,1975,1974,1973,1972,1971
Estas estadísticas en otros países:
línea de tiempo (timeline):
En esta escala de tiempo se presenta un gráfico de 1971 y 2015 de Iran, Islamic Rep.. Los datos de 1970 están ausentes. El número de observaciones reales por fecha: 43.
Fuente (nombre):
Indicadores del desarrollo mundial
Fuente (organización):
Estimates based on sources and methods described in "The Changing Wealth of Nations: Measuring Sustainable Development in the New Millennium" (World Bank, 2011).
Categorías:
Energy & Mining, Environment
Se ha actualizado:
23 abr 2017 año
Los indicadores de los cambios de valor en los últimos años
Mínimo:
0.001
1 ene 1971 año
Máximo:
3.527
1 ene 2015 año
A la fecha de observación
Valor
Cambio absoluto
El cambio con respecto al valor anterior
1 ene 1971 año
0.001
+0.001
0.0%
1 ene 1972 año
0.002
+0.001
93.31%
1 ene 1973 año
0.002
+0.001
45.41%
1 ene 1974 año
0.006
+0.004
180.28%
1 ene 1975 año
0.071
+0.065
1.06 mil%
1 ene 1976 año
0.191
+0.12
168.56%
1 ene 1977 año
0.164
-0.027
-14.19%
1 ene 1978 año
0.155
-0.009
-5.61%
1 ene 1979 año
0.109
-0.046
-29.5%
1 ene 1980 año
0.193
+0.084
76.58%
1 ene 1981 año
0.112
-0.081
-41.89%
1 ene 1982 año
0.072
-0.04
-35.61%
1 ene 1983 año
0.054
-0.018
-25.48%
1 ene 1984 año
0.115
+0.062
114.88%
1 ene 1985 año
0.112
-0.004
-3.32%
1 ene 1986 año
0.118
+0.006
5.78%
1 ene 1987 año
0.069
-0.049
-41.42%
1 ene 1988 año
0.09
+0.021
30.85%
1 ene 1989 año
0.102
+0.012
12.74%
1 ene 1990 año
0.142
+0.04
39.72%
1 ene 1991 año
0.295
+0.152
107.0%
1 ene 1994 año
0.279
-0.016
-5.47%
1 ene 1995 año
0.317
+0.038
13.65%
1 ene 1996 año
0.292
-0.025
-7.82%
1 ene 1997 año
0.329
+0.037
12.54%
1 ene 1998 año
0.429
+0.1
30.5%
1 ene 1999 año
0.347
-0.082
-19.1%
1 ene 2000 año
0.368
+0.021
5.93%
1 ene 2001 año
0.786
+0.418
113.72%
1 ene 2002 año
0.975
+0.189
24.12%
1 ene 2003 año
0.886
-0.089
-9.09%
1 ene 2004 año
0.8
-0.087
-9.76%
1 ene 2005 año
0.929
+0.129
16.11%
1 ene 2006 año
1.483
+0.554
59.65%
1 ene 2007 año
1.841
+0.358
24.16%
1 ene 2008 año
1.698
-0.143
-7.75%
1 ene 2009 año
2.013
+0.315
18.54%
1 ene 2010 año
1.934
-0.079
-3.92%
1 ene 2011 año
1.194
-0.74
-38.26%
1 ene 2012 año
1.839
+0.644
53.96%
1 ene 2013 año
2.595
+0.757
41.15%
1 ene 2014 año
3.006
+0.411
15.84%
1 ene 2015 año
3.527
+0.52
17.31%
Ranking de los países por los datos estadísticos actuales


Comentarios: