29
/es/
es
AIzaSyAYiBZKx7MnpbEhh9jyipgxe19OcubqV5w
April 1, 2024
125129
Egypt, Arab Rep.
EGY
true
2
1
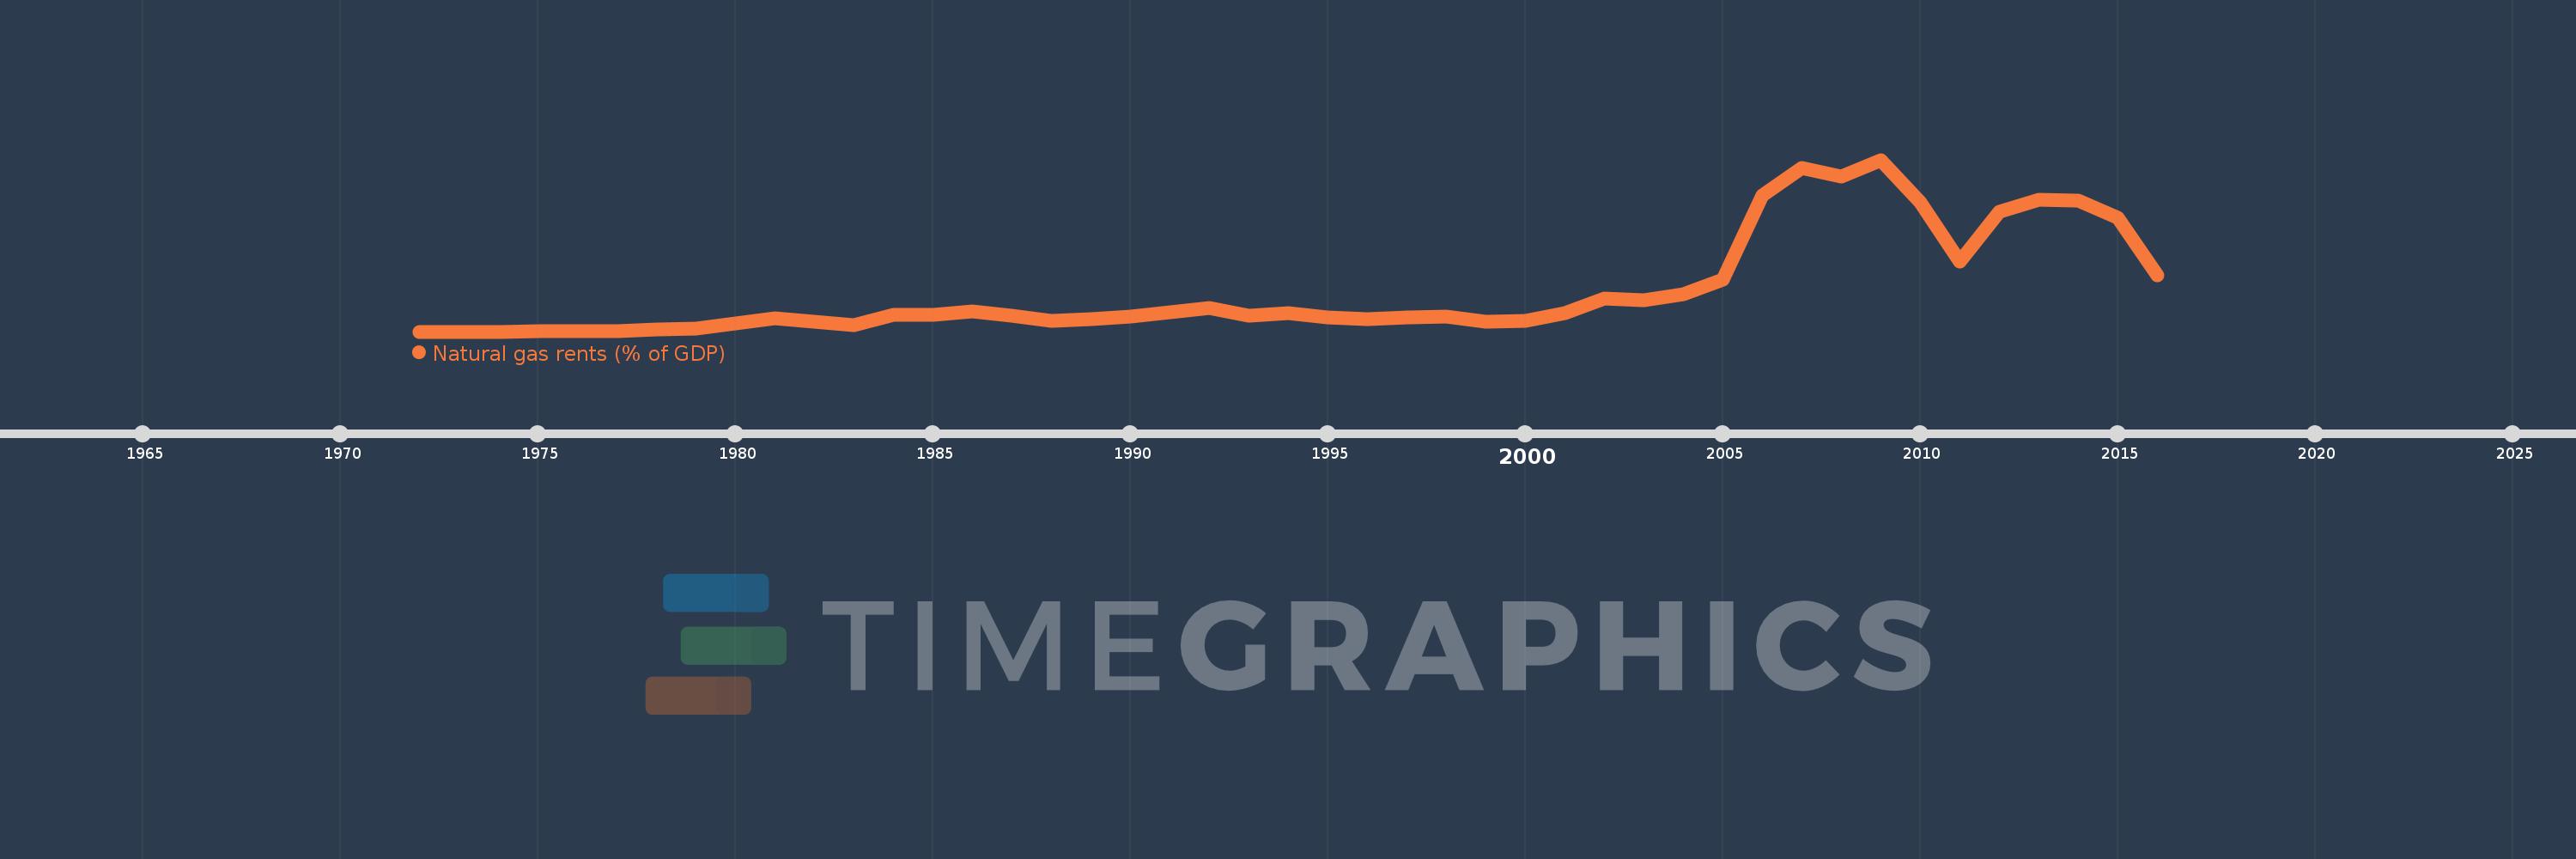
Natural gas rents (% of GDP)
2016,2015,2014,2013,2012,2011,2010,2009,2008,2007,2006,2005,2004,2003,2002,2001,2000,1999,1998,1997,1996,1995,1994,1993,1992,1991,1990,1989,1988,1987,1986,1985,1984,1983,1982,1981,1980,1979,1978,1977,1976,1975,1974,1973,1972
Estas estadísticas en otros países:
línea de tiempo (timeline):
En esta escala de tiempo se presenta un gráfico de 1972 y 2016 de Egypt, Arab Rep.. Los datos de 1971 están ausentes. El número de observaciones reales por fecha: 45.
Fuente (nombre):
Indicadores del desarrollo mundial
Fuente (organización):
Estimates based on sources and methods described in "The Changing Wealth of Nations: Measuring Sustainable Development in the New Millennium" (World Bank, 2011).
Categorías:
Energy & Mining, Environment
Se ha actualizado:
23 abr 2017 año
Los indicadores de los cambios de valor en los últimos años
Máximo:
2.357
1 ene 2009 año
A la fecha de observación
Valor
Cambio absoluto
El cambio con respecto al valor anterior
1 ene 1972 año
0.0
+0.0
0.0%
1 ene 1973 año
0.0
+0.0
5.91%
1 ene 1974 año
0.0
+0.0
353.98%
1 ene 1975 año
0.001
+0.001
900.61%
1 ene 1976 año
0.002
+0.001
104.95%
1 ene 1977 año
0.007
+0.005
198.5%
1 ene 1978 año
0.024
+0.017
241.21%
1 ene 1979 año
0.043
+0.019
77.25%
1 ene 1980 año
0.111
+0.068
157.32%
1 ene 1981 año
0.188
+0.076
68.67%
1 ene 1982 año
0.132
-0.055
-29.5%
1 ene 1983 año
0.091
-0.042
-31.58%
1 ene 1984 año
0.226
+0.135
149.37%
1 ene 1985 año
0.229
+0.003
1.46%
1 ene 1986 año
0.275
+0.046
20.09%
1 ene 1987 año
0.217
-0.058
-21.08%
1 ene 1988 año
0.146
-0.071
-32.58%
1 ene 1989 año
0.175
+0.028
19.26%
1 ene 1990 año
0.21
+0.035
20.07%
1 ene 1991 año
0.271
+0.061
29.2%
1 ene 1992 año
0.328
+0.057
21.11%
1 ene 1993 año
0.213
-0.115
-35.08%
1 ene 1994 año
0.254
+0.041
19.21%
1 ene 1995 año
0.191
-0.063
-24.93%
1 ene 1996 año
0.176
-0.015
-7.61%
1 ene 1997 año
0.194
+0.018
9.95%
1 ene 1998 año
0.201
+0.007
3.86%
1 ene 1999 año
0.133
-0.068
-34.01%
1 ene 2000 año
0.144
+0.012
8.75%
1 ene 2001 año
0.258
+0.113
78.45%
1 ene 2002 año
0.448
+0.19
73.7%
1 ene 2003 año
0.432
-0.015
-3.39%
1 ene 2004 año
0.516
+0.084
19.38%
1 ene 2005 año
0.716
+0.2
38.78%
1 ene 2006 año
1.87
+1.154
161.05%
1 ene 2007 año
2.249
+0.379
20.29%
1 ene 2008 año
2.127
-0.122
-5.44%
1 ene 2009 año
2.357
+0.23
10.81%
1 ene 2010 año
1.779
-0.578
-24.53%
1 ene 2011 año
0.96
-0.819
-46.05%
1 ene 2012 año
1.641
+0.681
70.96%
1 ene 2013 año
1.811
+0.17
10.37%
1 ene 2014 año
1.796
-0.014
-0.8%
1 ene 2015 año
1.556
-0.24
-13.38%
1 ene 2016 año
0.774
-0.782
-50.26%
Ranking de los países por los datos estadísticos actuales


Comentarios: