29
/es/
es
AIzaSyAYiBZKx7MnpbEhh9jyipgxe19OcubqV5w
April 1, 2024
150027
Honduras
HND
true
2
1
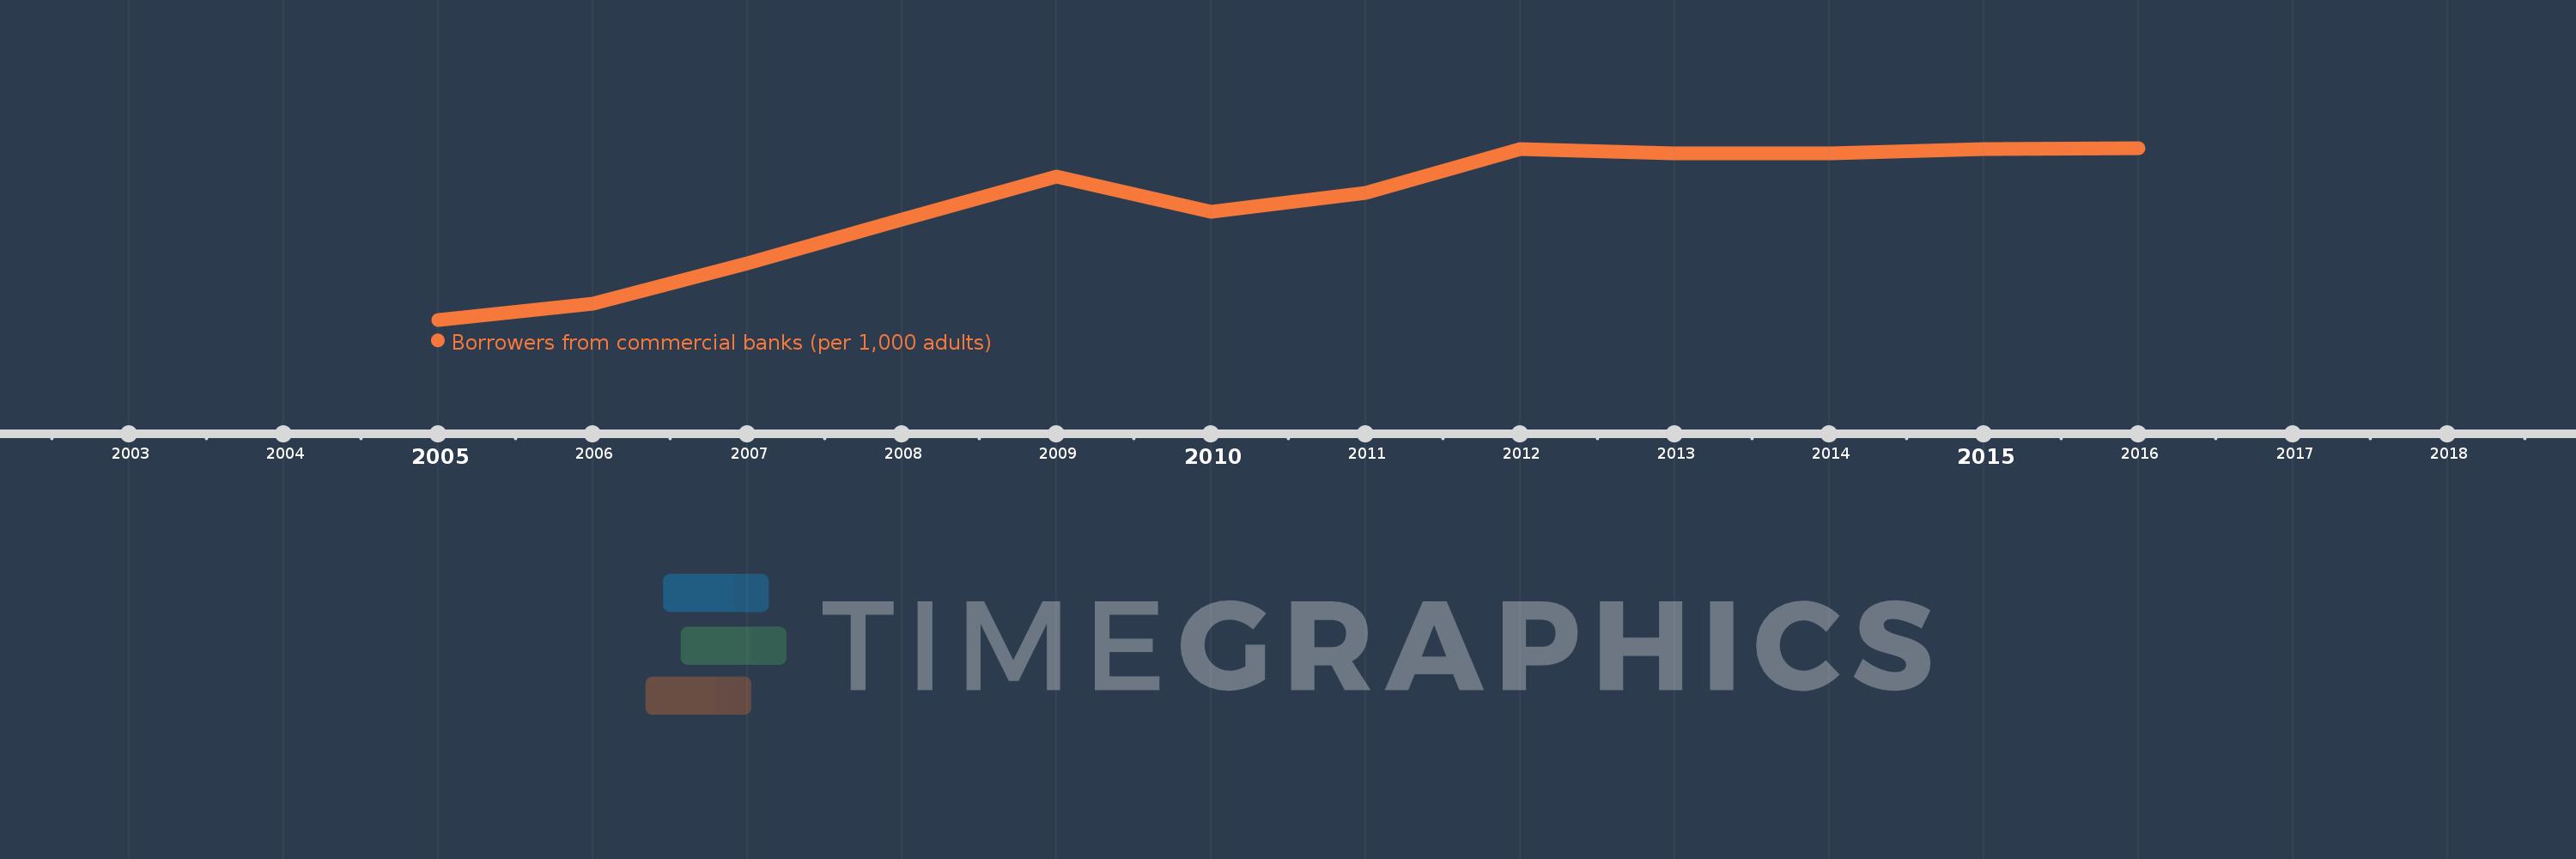
Borrowers from commercial banks (per 1,000 adults)
2016,2015,2014,2013,2012,2011,2010,2009,2008,2007,2006,2005
Estas estadísticas en otros países:
línea de tiempo (timeline):
En esta escala de tiempo se presenta un gráfico de 2005 y 2016 de Honduras. Los datos de 2004 están ausentes. El número de observaciones reales por fecha: 12.
Fuente (nombre):
Indicadores del desarrollo mundial
Fuente (organización):
International Monetary Fund, Financial Access Survey.
Categorías:
Financial Sector
Se ha actualizado:
23 abr 2017 año
Los indicadores de los cambios de valor en los últimos años
Mínimo:
54.522
1 ene 2005 año
Máximo:
121.617
1 ene 2016 año
A la fecha de observación
Valor
Cambio absoluto
El cambio con respecto al valor anterior
1 ene 2005 año
54.522
+54.522
0.0%
1 ene 2006 año
60.904
+6.383
11.71%
1 ene 2007 año
76.537
+15.633
25.67%
1 ene 2008 año
93.663
+17.126
22.38%
1 ene 2009 año
110.297
+16.633
17.76%
1 ene 2010 año
96.647
-13.649
-12.38%
1 ene 2011 año
104.17
+7.522
7.78%
1 ene 2012 año
121.256
+17.087
16.4%
1 ene 2013 año
119.48
-1.776
-1.47%
1 ene 2014 año
119.534
+0.054
0.04%
1 ene 2015 año
121.149
+1.615
1.35%
1 ene 2016 año
121.617
+0.468
0.39%
Ranking de los países por los datos estadísticos actuales


Comentarios: