29
/es/
es
AIzaSyAYiBZKx7MnpbEhh9jyipgxe19OcubqV5w
April 1, 2024
106735
China
CHN
true
2
1
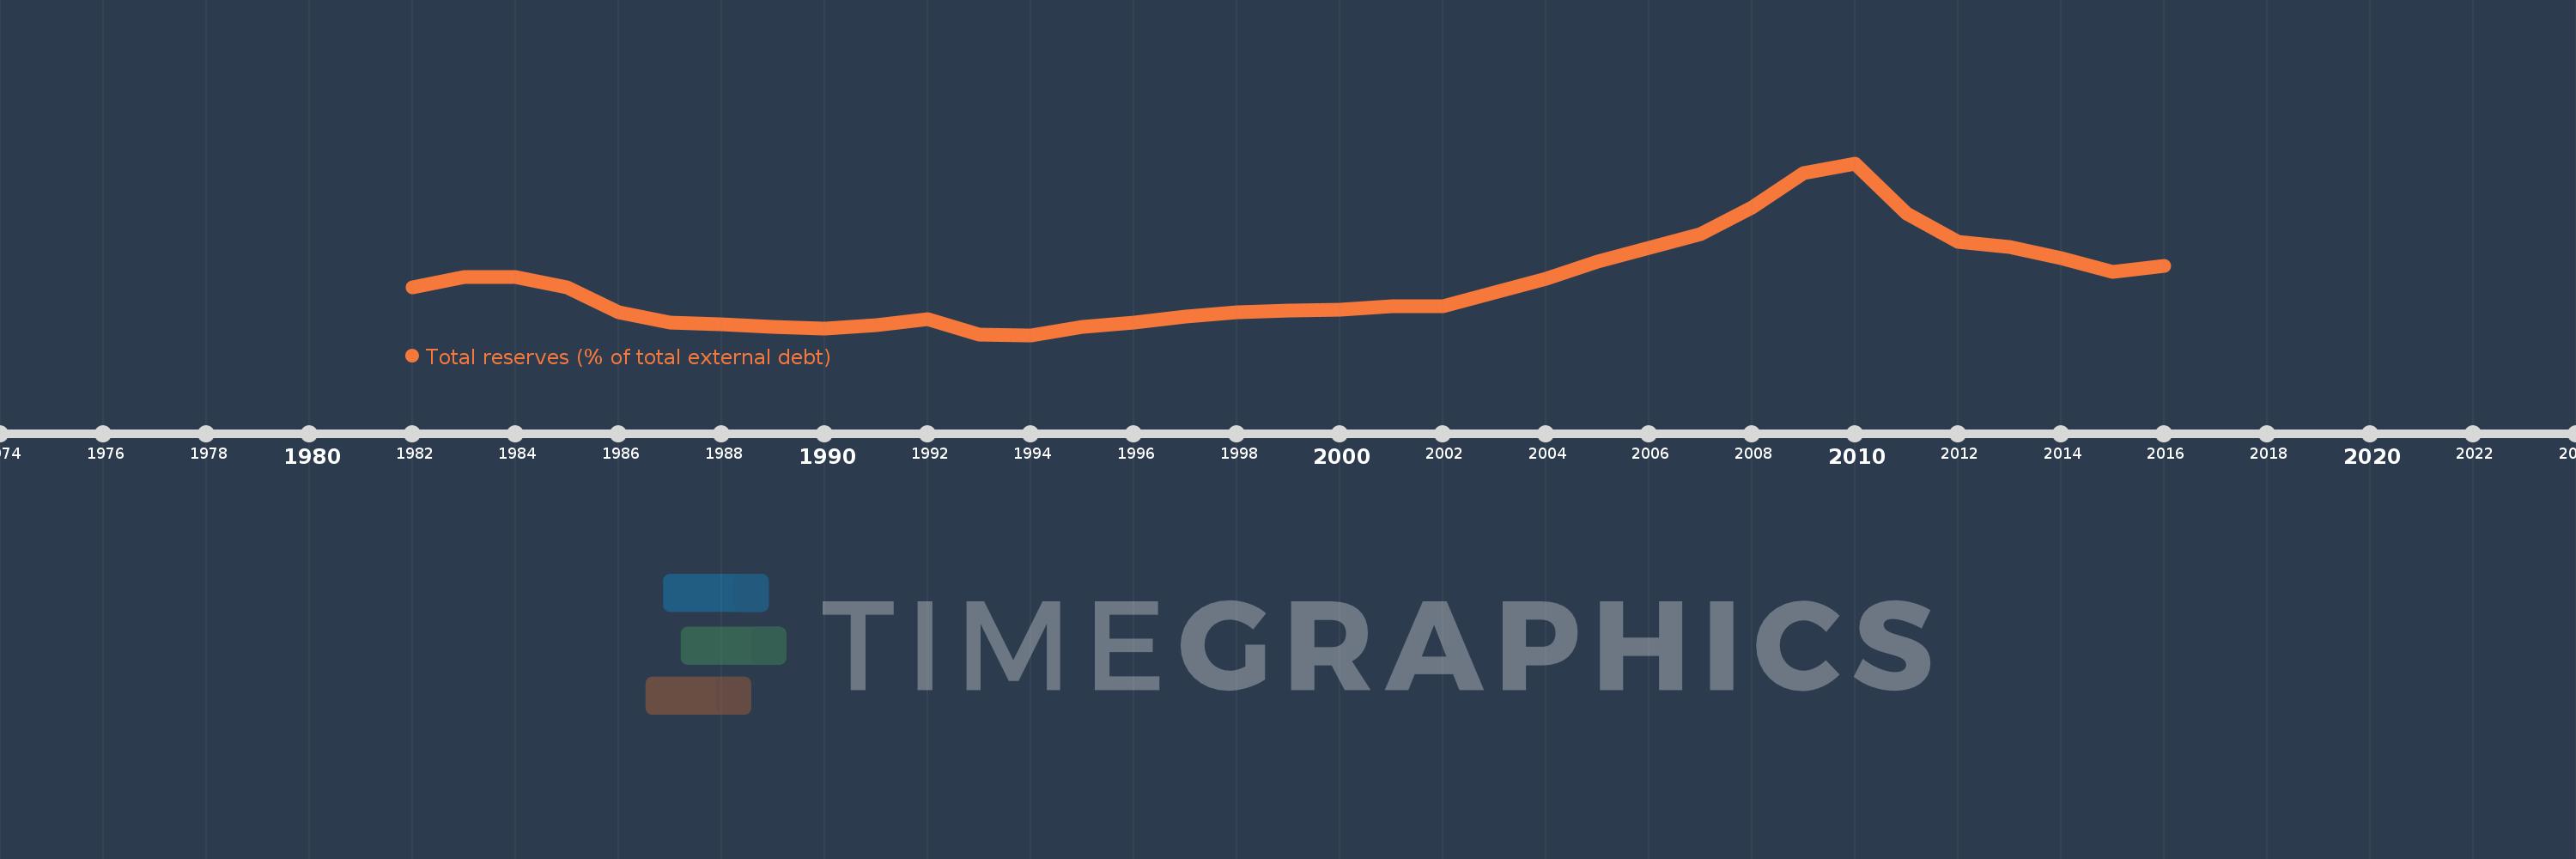
Total reserves (% of total external debt)
2016,2015,2014,2013,2012,2011,2010,2009,2008,2007,2006,2005,2004,2003,2002,2001,2000,1999,1998,1997,1996,1995,1994,1993,1992,1991,1990,1989,1988,1987,1986,1985,1984,1983,1982
Estas estadísticas en otros países:
línea de tiempo (timeline):
En esta escala de tiempo se presenta un gráfico de 1982 y 2016 de China. Los datos de 1981 están ausentes. El número de observaciones reales por fecha: 35.
Fuente (nombre):
Indicadores del desarrollo mundial
Fuente (organización):
World Bank, International Debt Statistics.
Categorías:
Financial Sector, External Debt
Se ha actualizado:
23 abr 2017 año
Los indicadores de los cambios de valor en los últimos años
Mínimo:
31.827
1 ene 1994 año
Máximo:
547.935
1 ene 2010 año
A la fecha de observación
Valor
Cambio absoluto
El cambio con respecto al valor anterior
1 ene 1982 año
174.307
+174.307
0.0%
1 ene 1983 año
205.162
+30.855
17.7%
1 ene 1984 año
206.329
+1.167
0.57%
1 ene 1985 año
176.042
-30.287
-14.68%
1 ene 1986 año
101.09
-74.952
-42.58%
1 ene 1987 año
69.215
-31.875
-31.53%
1 ene 1988 año
63.535
-5.68
-8.21%
1 ene 1989 año
55.966
-7.569
-11.91%
1 ene 1990 año
51.305
-4.661
-8.33%
1 ene 1991 año
62.341
+11.036
21.51%
1 ene 1992 año
79.93
+17.588
28.21%
1 ene 1993 año
34.314
-45.616
-57.07%
1 ene 1994 año
31.827
-2.487
-7.25%
1 ene 1995 año
57.519
+25.692
80.72%
1 ene 1996 año
67.989
+10.471
18.2%
1 ene 1997 año
86.735
+18.745
27.57%
1 ene 1998 año
99.83
+13.096
15.1%
1 ene 1999 año
106.136
+6.306
6.32%
1 ene 2000 año
108.634
+2.498
2.35%
1 ene 2001 año
117.915
+9.281
8.54%
1 ene 2002 año
119.547
+1.632
1.38%
1 ene 2003 año
160.754
+41.207
34.47%
1 ene 2004 año
201.495
+40.741
25.34%
1 ene 2005 año
253.475
+51.98
25.8%
1 ene 2006 año
293.463
+39.988
15.78%
1 ene 2007 año
334.46
+40.997
13.97%
1 ene 2008 año
414.067
+79.607
23.8%
1 ene 2009 año
517.154
+103.087
24.9%
1 ene 2010 año
547.935
+30.781
5.95%
1 ene 2011 año
396.712
-151.223
-27.6%
1 ene 2012 año
311.644
-85.067
-21.44%
1 ene 2013 año
297.608
-14.037
-4.5%
1 ene 2014 año
263.68
-33.927
-11.4%
1 ene 2015 año
220.274
-43.407
-16.46%
1 ene 2016 año
240.096
+19.822
9.0%
Ranking de los países por los datos estadísticos actuales


Comentarios: