29
/es/
es
AIzaSyAYiBZKx7MnpbEhh9jyipgxe19OcubqV5w
April 1, 2024
104318
Chad
TCD
true
2
1
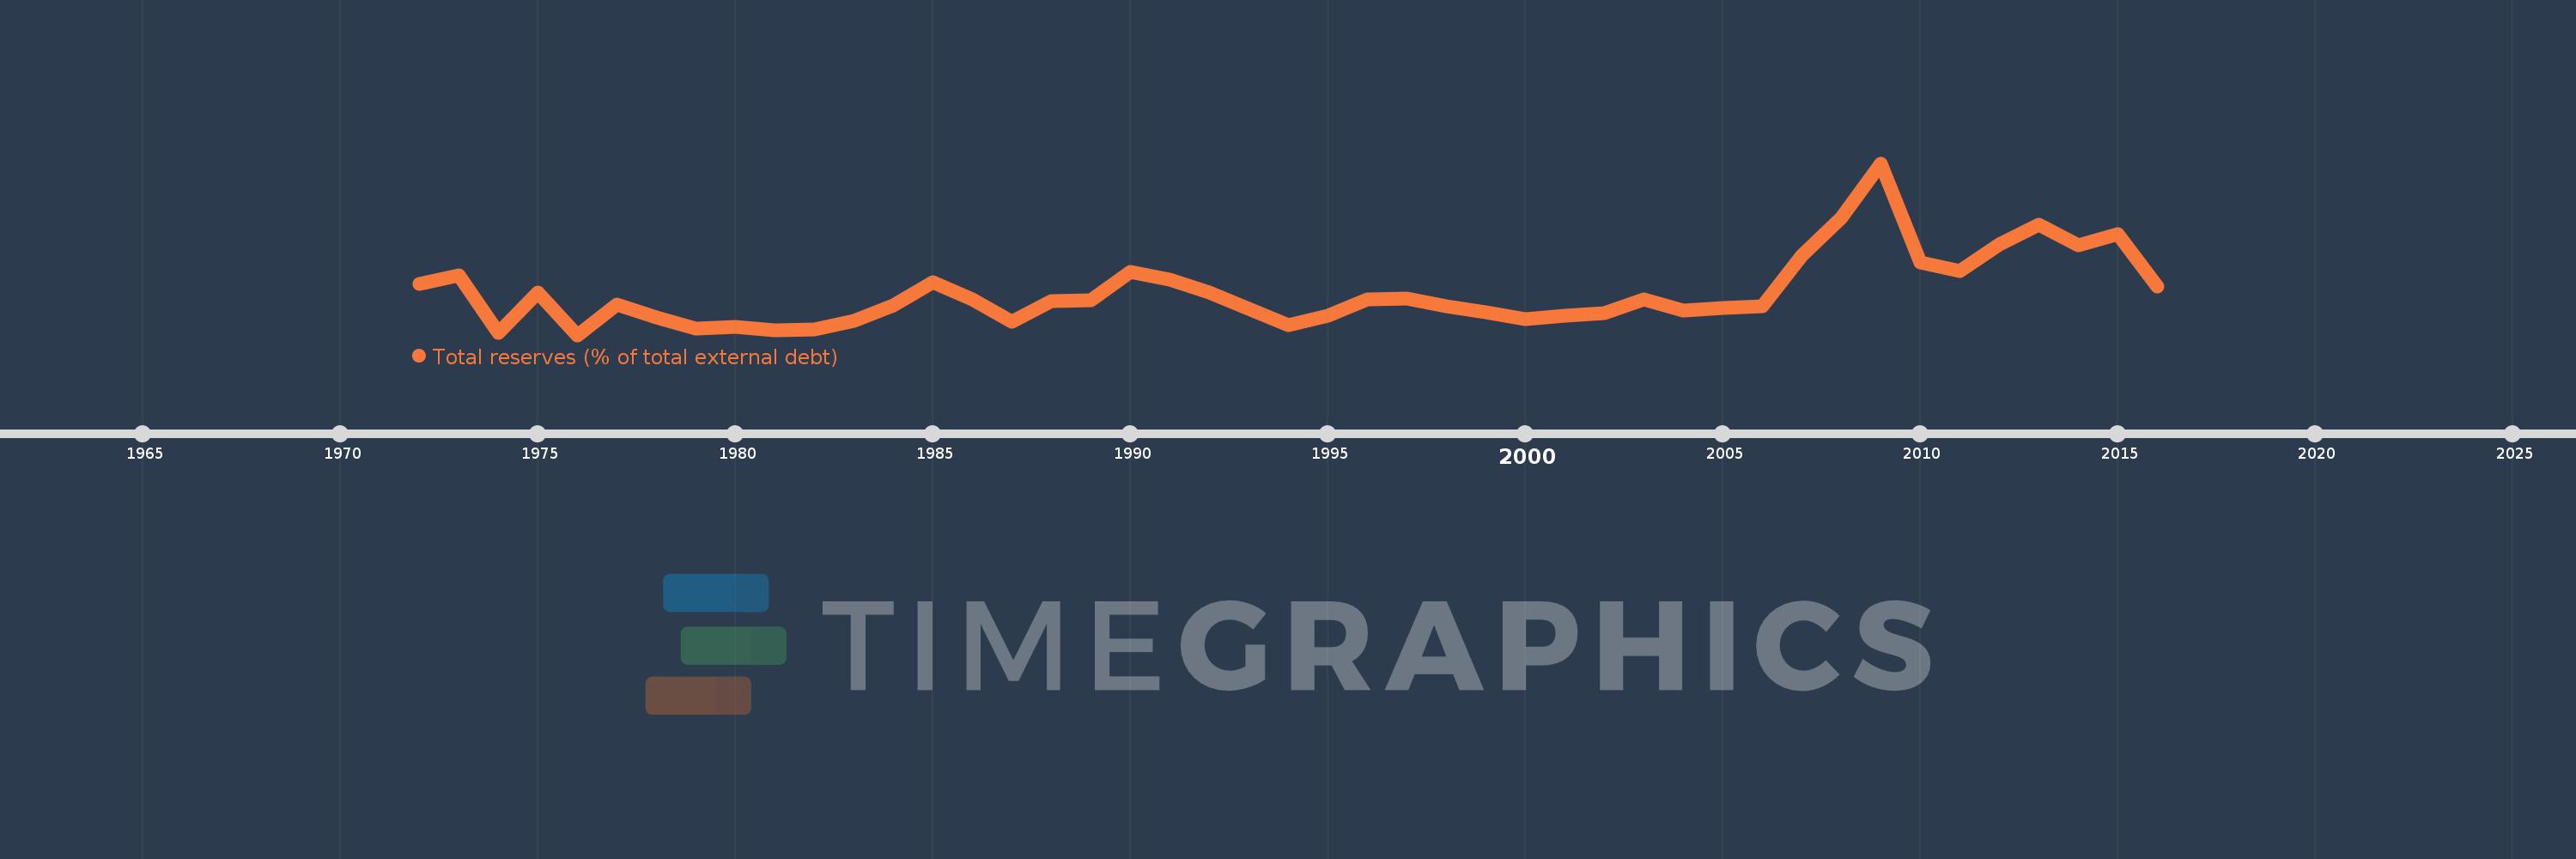
Total reserves (% of total external debt)
2016,2015,2014,2013,2012,2011,2010,2009,2008,2007,2006,2005,2004,2003,2002,2001,2000,1999,1998,1997,1996,1995,1994,1993,1992,1991,1990,1989,1988,1987,1986,1985,1984,1983,1982,1981,1980,1979,1978,1977,1976,1975,1974,1973,1972
Estas estadísticas en otros países:
línea de tiempo (timeline):
En esta escala de tiempo se presenta un gráfico de 1972 y 2016 de Chad. Los datos de 1971 están ausentes. El número de observaciones reales por fecha: 45.
Fuente (nombre):
Indicadores del desarrollo mundial
Fuente (organización):
World Bank, International Debt Statistics.
Categorías:
Financial Sector, External Debt
Se ha actualizado:
23 abr 2017 año
Los indicadores de los cambios de valor en los últimos años
Mínimo:
2.138
1 ene 1976 año
Máximo:
75.183
1 ene 2009 año
A la fecha de observación
Valor
Cambio absoluto
El cambio con respecto al valor anterior
1 ene 1972 año
23.886
+23.886
0.0%
1 ene 1973 año
27.577
+3.691
15.45%
1 ene 1974 año
3.067
-24.51
-88.88%
1 ene 1975 año
20.08
+17.013
554.76%
1 ene 1976 año
2.138
-17.942
-89.35%
1 ene 1977 año
14.931
+12.792
598.2%
1 ene 1978 año
9.536
-5.394
-36.13%
1 ene 1979 año
4.88
-4.656
-48.82%
1 ene 1980 año
5.545
+0.665
13.63%
1 ene 1981 año
4.142
-1.403
-25.31%
1 ene 1982 año
4.571
+0.429
10.36%
1 ene 1983 año
7.987
+3.416
74.73%
1 ene 1984 año
14.741
+6.754
84.56%
1 ene 1985 año
24.532
+9.791
66.42%
1 ene 1986 año
17.133
-7.399
-30.16%
1 ene 1987 año
7.694
-9.439
-55.09%
1 ene 1988 año
16.52
+8.826
114.71%
1 ene 1989 año
17.092
+0.572
3.47%
1 ene 1990 año
29.143
+12.051
70.5%
1 ene 1991 año
25.684
-3.458
-11.87%
1 ene 1992 año
20.067
-5.618
-21.87%
1 ene 1993 año
13.12
-6.947
-34.62%
1 ene 1994 año
6.252
-6.868
-52.35%
1 ene 1995 año
10.239
+3.987
63.77%
1 ene 1996 año
17.439
+7.2
70.32%
1 ene 1997 año
17.81
+0.371
2.12%
1 ene 1998 año
14.531
-3.279
-18.41%
1 ene 1999 año
11.97
-2.561
-17.62%
1 ene 2000 año
8.857
-3.113
-26.0%
1 ene 2001 año
10.352
+1.494
16.87%
1 ene 2002 año
11.45
+1.098
10.61%
1 ene 2003 año
17.438
+5.988
52.3%
1 ene 2004 año
12.455
-4.982
-28.57%
1 ene 2005 año
13.715
+1.259
10.11%
1 ene 2006 año
14.192
+0.477
3.48%
1 ene 2007 año
35.973
+21.781
153.47%
1 ene 2008 año
52.161
+16.188
45.0%
1 ene 2009 año
75.183
+23.022
44.14%
1 ene 2010 año
32.902
-42.281
-56.24%
1 ene 2011 año
29.311
-3.591
-10.91%
1 ene 2012 año
40.538
+11.227
38.3%
1 ene 2013 año
48.942
+8.404
20.73%
1 ene 2014 año
40.446
-8.497
-17.36%
1 ene 2015 año
44.911
+4.465
11.04%
1 ene 2016 año
22.815
-22.096
-49.2%
Ranking de los países por los datos estadísticos actuales


Comentarios: