30
/de/
AIzaSyAYiBZKx7MnpbEhh9jyipgxe19OcubqV5w
April 1, 2024
95248
Burkina Faso
BFA
true
2
1
Net official flows from UN agencies, IAEA (current US$)
2015,2014,2013,2012,2011,2010,2009,2008,2007
Download
Bibliothek der Globalstatistik →Burkina Faso →

Net official flows from UN agencies, IAEA (current US$)

Diese Statistik in anderen Ländern:

AfghanistanAlbaniaAlgeriaAngolaArab WorldArgentinaArmeniaAzerbaijanBangladeshBelarusBelizeBeninBoliviaBosnia and HerzegovinaBotswanaBrazilBurkina FasoBurundiCambodiaCameroonCaribbean small statesCentral African RepublicCentral Europe and the BalticsChadChileChinaColombiaCongo, Dem. Rep.Costa RicaCote d'IvoireCroatiaCubaDominican RepublicEast Asia & PacificEast Asia & Pacific (excluding high income)East Asia & Pacific (IDA & IBRD countries)EcuadorEgypt, Arab Rep.El SalvadorEritreaEthiopiaEurope & Central AsiaEurope & Central Asia (excluding high income)Europe & Central Asia (IDA & IBRD countries)European UnionFragile and conflict affected situationsGabonGeorgiaGhanaGuatemalaHaitiHeavily indebted poor countries (HIPC)High incomeHondurasIBRD onlyIDA & IBRD totalIDA blendIDA onlyIDA totalIndonesiaIran, Islamic Rep.IraqJamaicaJordanKazakhstanKenyaKyrgyz RepublicLao PDRLatin America & Caribbean Latin America & Caribbean (excluding high income)Latin America & the Caribbean (IDA & IBRD countries)Least developed countries: UN classificationLebanonLesothoLibyaLow & middle incomeLow incomeLower middle incomeMacedonia, FYRMadagascarMalawiMalaysiaMaliMauritaniaMauritiusMexicoMiddle East & North AfricaMiddle East & North Africa (excluding high income)Middle East & North Africa (IDA & IBRD countries)Middle incomeMoldovaMongoliaMontenegroMoroccoMozambiqueMyanmarNamibiaNepalNicaraguaNigerNigeriaNorth AmericaOECD membersOmanOther small statesPacific island small statesPakistanPalauPanamaParaguayPeruPhilippinesSenegalSerbiaSeychellesSierra LeoneSmall statesSouth AfricaSouth AsiaSouth Asia (IDA & IBRD)Sri LankaSub-Saharan Africa Sub-Saharan Africa (excluding high income)Sub-Saharan Africa (IDA & IBRD countries)SudanSyrian Arab RepublicTajikistanTanzaniaThailandTogoTunisiaTurkeyUgandaUkraineUpper middle incomeUruguayUzbekistanVenezuela, RBVietnamWest Bank and GazaWorldYemen, Rep.ZambiaZimbabwe

Zeitlinie:

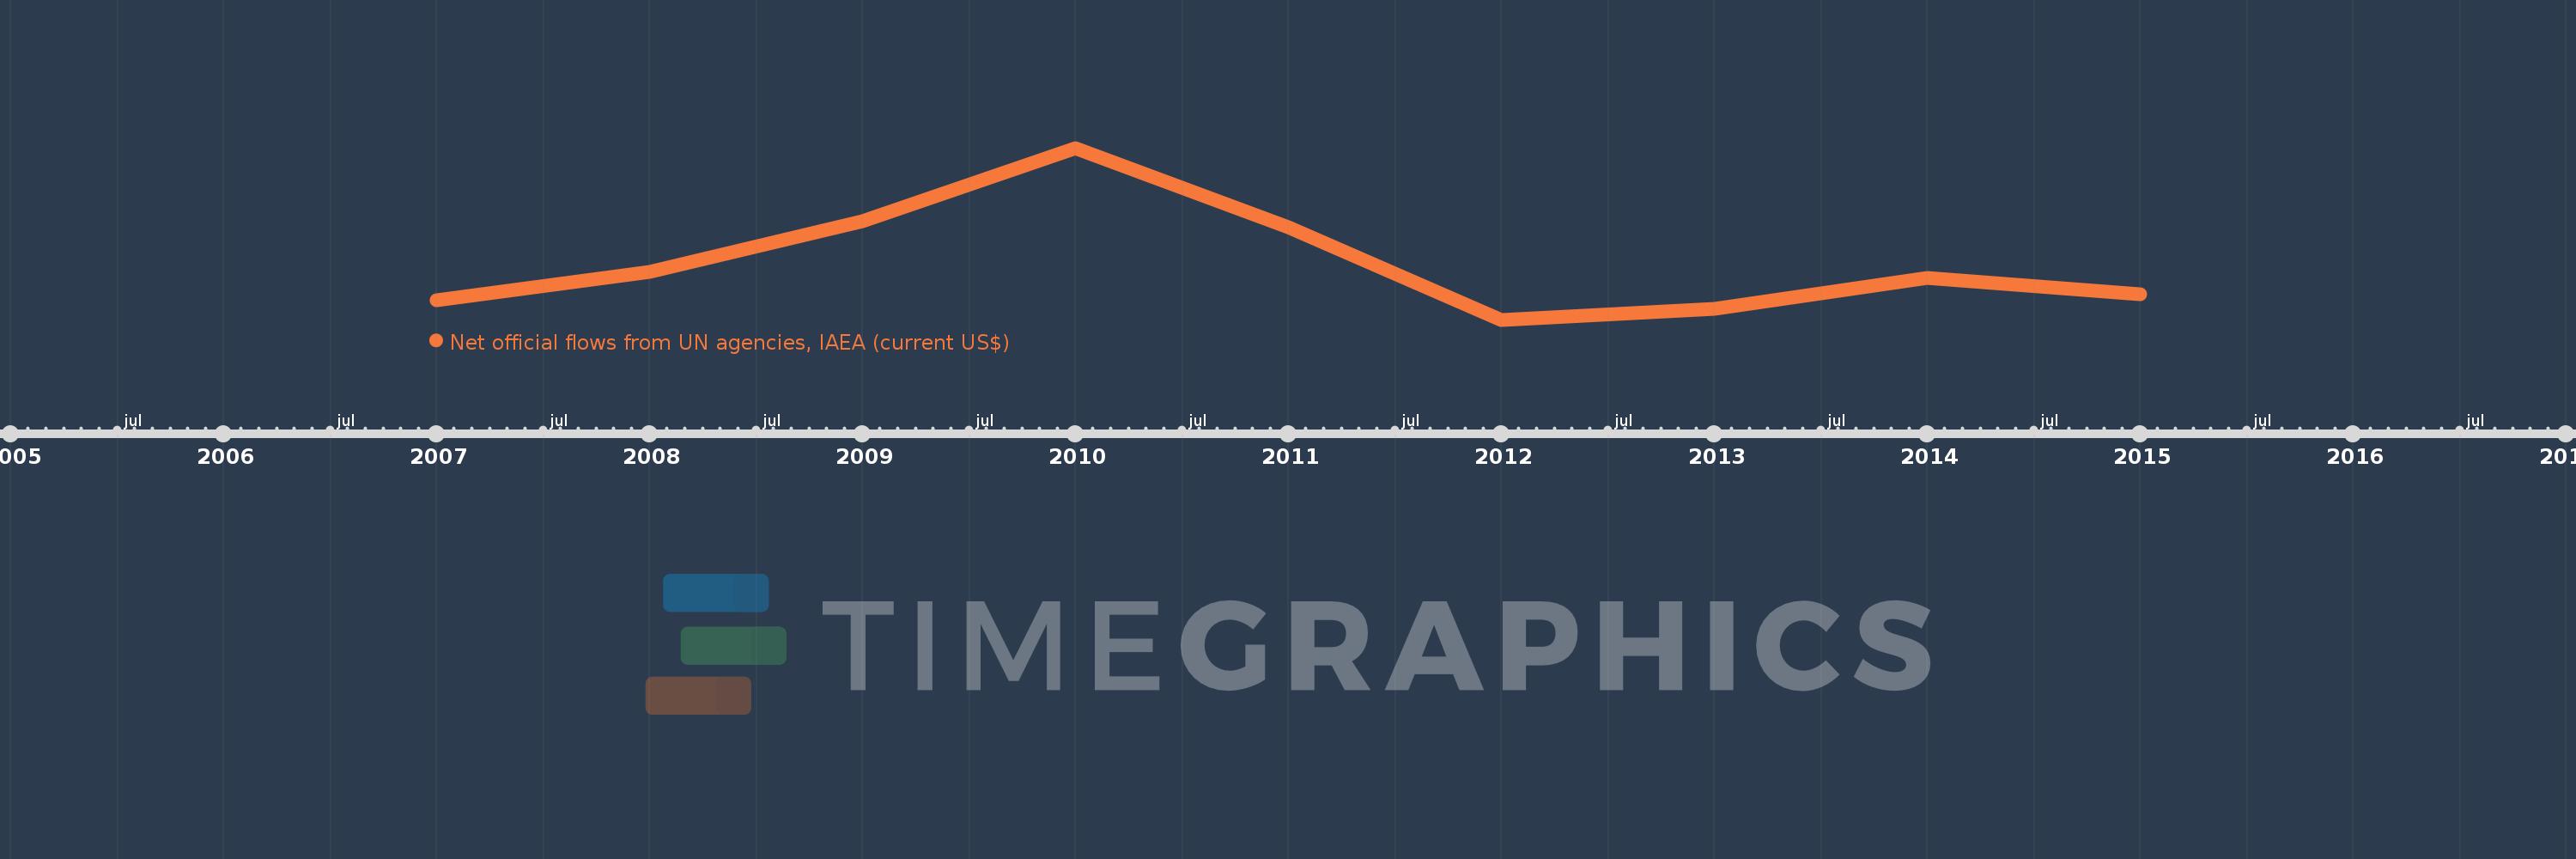
Diese Zeitleiste vorliegt die Graphik ab 2007 J. bis 2015 J. Burkina Faso. Die Angaben bis 2006 J. sind nicht vorhanden. Die Zahl aktueller Beobachtungen nach Daten: 9.

Die Quelle (Bezeichnung):

Kennzahlen der Weltentwicklung

Die Quelle (Einrichtung):

Development Assistance Committee of the Organisation for Economic Co-operation and Development, Geographical Distribution of Financial Flows to Developing Countries, Development Co-operation Report, and International Development Statistics database. Data are available online at: www.oecd.org/dac/stats/idsonline.

Kategorien:

Aid Effectiveness

Es wurde aktualisiert:

23 Apr 2017 Jahr

Kennzahlen der Wertänderungen vom Jahr zum Jahr

im Durchschnitt:
391.111 Tsnd.
Minimum:
190.0 Tsnd.
1 Jan 2012 Jahr
Maximum:
800.0 Tsnd.
1 Jan 2010 Jahr
Zum Datum der Beobachtung
Wert
Absolute Veränderung
Die Veränderung bezüglich dem vorherigen Wert
1 Jan 2007 Jahr
260.0 Tsnd.
+260.0 Tsnd.
0.0%
1 Jan 2008 Jahr
360.0 Tsnd.
+100.0 Tsnd.
38.46%
1 Jan 2009 Jahr
540.0 Tsnd.
+180.0 Tsnd.
50.0%
1 Jan 2010 Jahr
800.0 Tsnd.
+260.0 Tsnd.
48.15%
1 Jan 2011 Jahr
520.0 Tsnd.
-280.0 Tsnd.
-35.0%
1 Jan 2012 Jahr
190.0 Tsnd.
-330.0 Tsnd.
-63.46%
1 Jan 2013 Jahr
230.0 Tsnd.
+40.0 Tsnd.
21.05%
1 Jan 2014 Jahr
340.0 Tsnd.
+110.0 Tsnd.
47.83%
1 Jan 2015 Jahr
280.0 Tsnd.
-60.0 Tsnd.
-17.65%

Bewertung der Länder gemäß mit laufender Statistik nach Jahren