29
/de/
de
AIzaSyAYiBZKx7MnpbEhh9jyipgxe19OcubqV5w
April 1, 2024
58389
South Asia (IDA & IBRD)
TSA
false
2
1
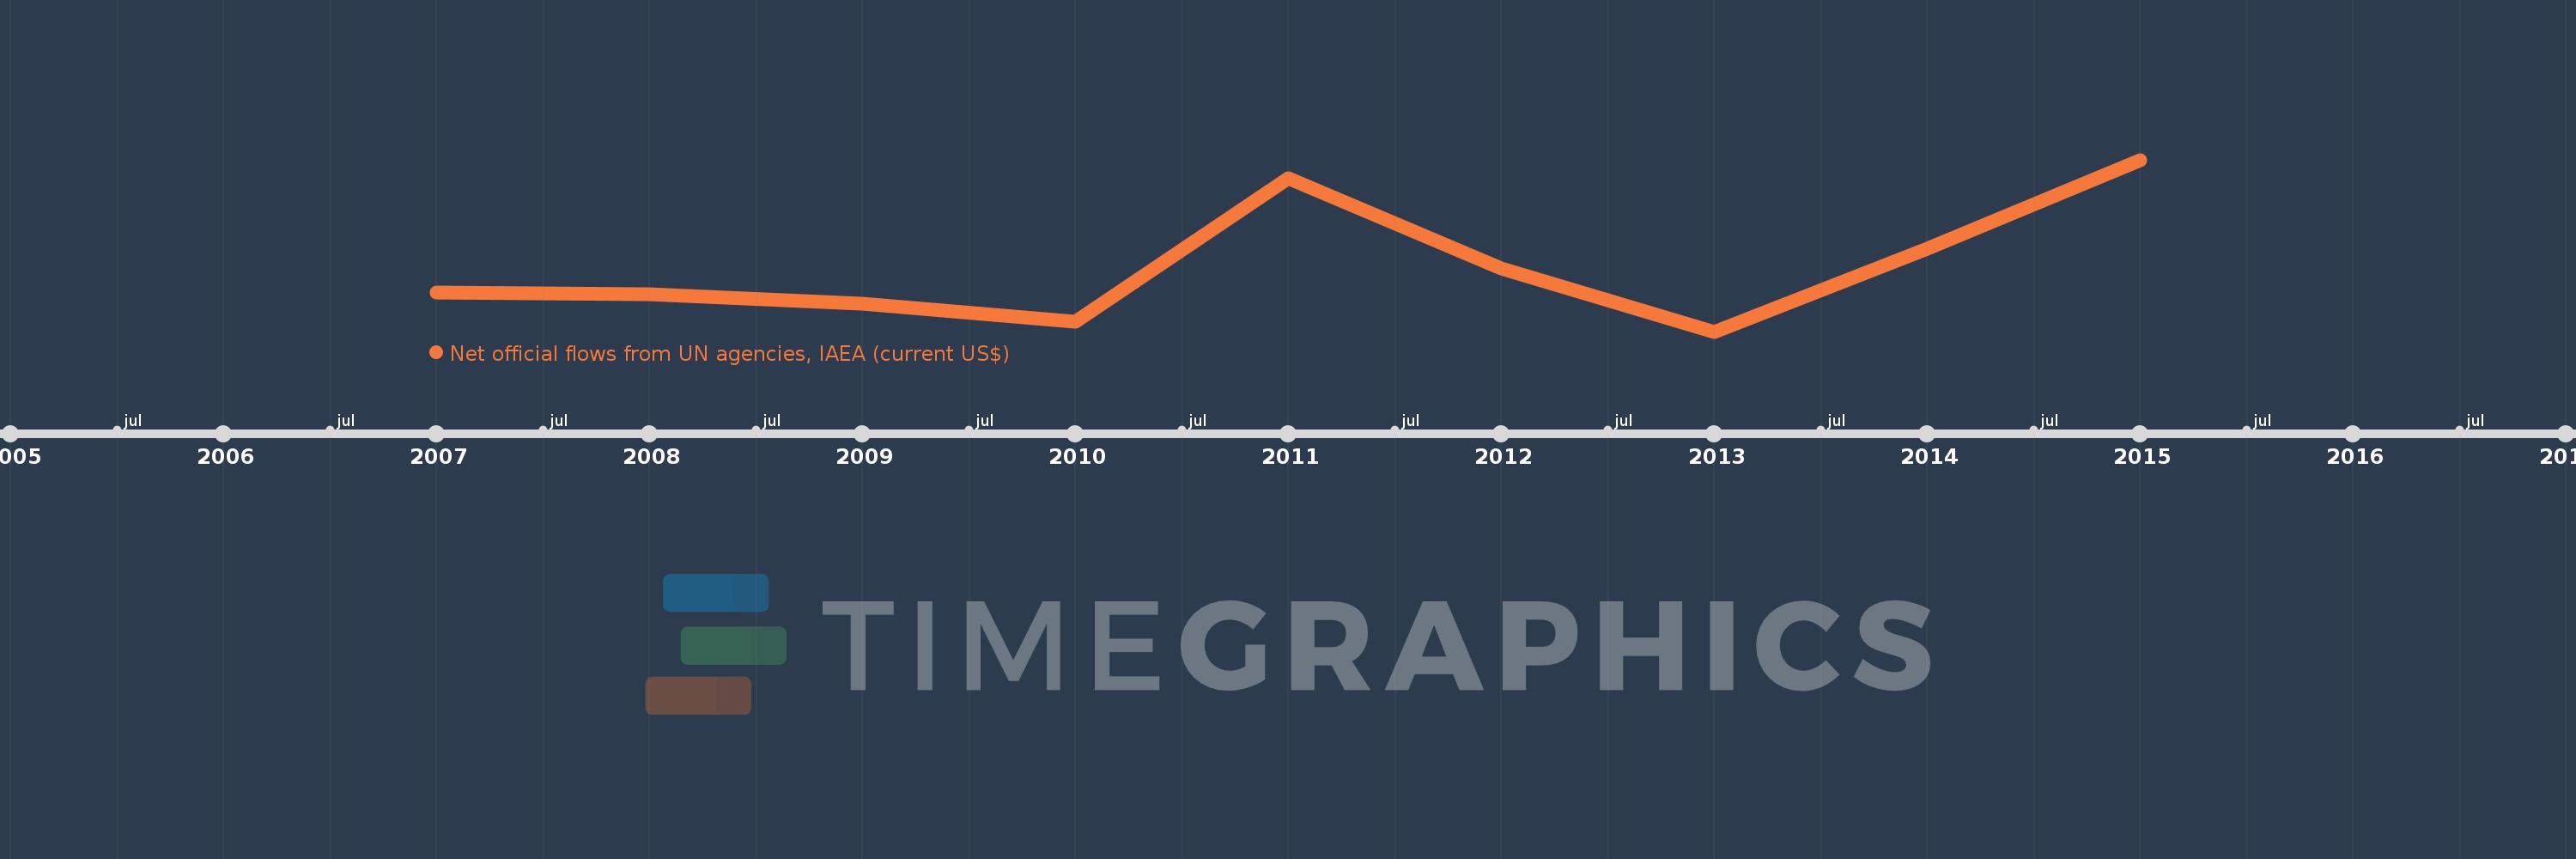
Net official flows from UN agencies, IAEA (current US$)
2015,2014,2013,2012,2011,2010,2009,2008,2007
Diese Statistik in anderen Ländern:
Zeitlinie:
Diese Zeitleiste vorliegt die Graphik ab 2007 J. bis 2015 J. South Asia (IDA & IBRD). Die Angaben bis 2006 J. sind nicht vorhanden. Die Zahl aktueller Beobachtungen nach Daten: 9.
Die Quelle (Bezeichnung):
Kennzahlen der Weltentwicklung
Die Quelle (Einrichtung):
Development Assistance Committee of the Organisation for Economic Co-operation and Development, Geographical Distribution of Financial Flows to Developing Countries, Development Co-operation Report, and International Development Statistics database. Data are available online at: www.oecd.org/dac/stats/idsonline.
Kategorien:
Aid Effectiveness
Es wurde aktualisiert:
23 Apr 2017 Jahr
Kennzahlen der Wertänderungen vom Jahr zum Jahr
im Durchschnitt:
2.587 Mln.
Minimum:
1.92 Mln.
1 Jan 2013 Jahr
Maximum:
3.68 Mln.
1 Jan 2015 Jahr
Zum Datum der Beobachtung
Wert
Absolute Veränderung
Die Veränderung bezüglich dem vorherigen Wert
1 Jan 2007 Jahr
2.32 Mln.
+2.32 Mln.
0.0%
1 Jan 2008 Jahr
2.3 Mln.
-20.0 Tsnd.
-0.86%
1 Jan 2009 Jahr
2.21 Mln.
-90.0 Tsnd.
-3.91%
1 Jan 2010 Jahr
2.02 Mln.
-190.0 Tsnd.
-8.6%
1 Jan 2011 Jahr
3.49 Mln.
+1.47 Mln.
72.77%
1 Jan 2012 Jahr
2.57 Mln.
-920.0 Tsnd.
-26.36%
1 Jan 2013 Jahr
1.92 Mln.
-650.0 Tsnd.
-25.29%
1 Jan 2014 Jahr
2.77 Mln.
+850.0 Tsnd.
44.27%
1 Jan 2015 Jahr
3.68 Mln.
+910.0 Tsnd.
32.85%
Bewertung der Länder gemäß mit laufender Statistik nach Jahren


Kommentare: